The relationship of plants to their environment
Author: Mária Höhn
6.1. The ecological environment
Plant populations thrive best within the most suitable habitats i.e., places in which the environmental conditions satisfy the organisms’ needs. In fact, the occurrence of any population in a habitat depends on the environment. If any of the environmental factors fall outside a population’s tolerance limits, the survival of that population in that particular habitat becomes critical. As a result, any environmental factor reaching the tolerance limit of a population can be considered a limiting factor.
The ecological tolerance of a population can therefore be defined as the response of that population to limiting environmental factors, which can be expressed e.g. in terms of biological production.
It is important to know that the ecological environment can only be interpreted in relation to the living organisms. Ecological factors are only those that directly affect the existence of plants. For example, the availability of light for oak trees in a park of Budapest is completely different compared to the light conditions within a closed forest of e.g. on the Pilis Mountain. Light conditions on PilisMountain will not have any effect on the trees of the park, and only the light availability in Budapest will be the limiting factor.
We know that light is an absolutely essential energy source in the process of photosynthesis. If there is no light, plants stop photosynthesizing and producing organic matter (i.e., biomass). The intensity of light is therefore a limiting environmental factor for plants. Once the light intensity reaches a certain value, it triggers the process of photosynthesis, but if the light intensity is too high, it becomes a source of stress. Excessive light can damage the photosynthetic system and can increase the leaf temperature, which in turn increases evaporation and leads to water loss and dehydration.
By measuring the biomass productions of individuals in response to increasing light intensities we can quantify the ecological tolerance of plants to light. Somewhere between the minimum and maximum values of biomass production lays an optimal value necessary to achieve the highest biological production (Figure 1). By measuring several individuals of a population we can establish the population light tolerance curve.
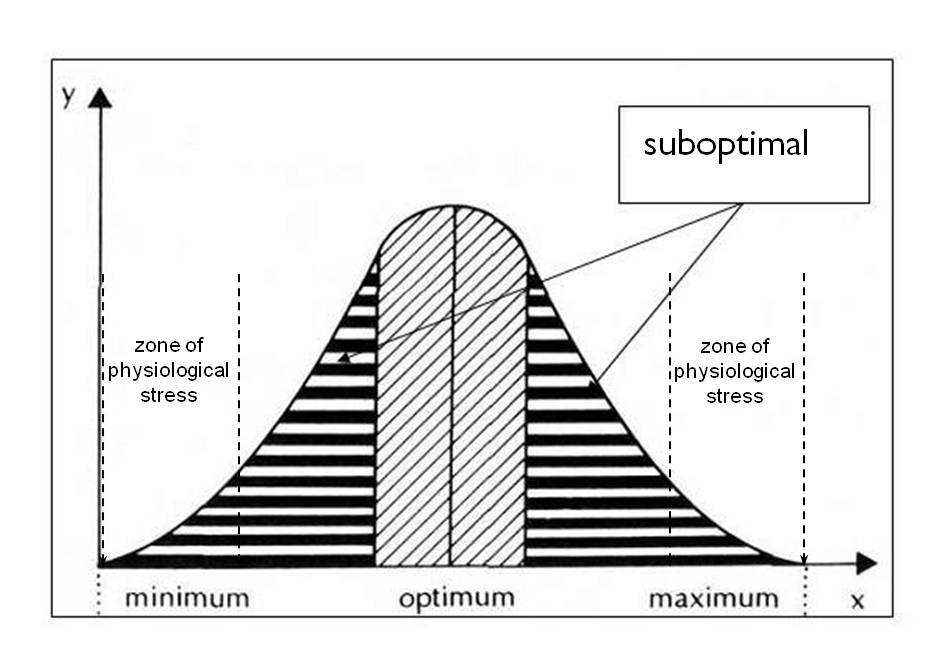
Figure 1: The tolerance curve of a population to light conditions:
y = f(x), where x – light intensity, y - biological production (growth)
The population tolerance curves can be established for various environmental factors. By comparing different tolerance curves we realize that different populations can give very different responses to the environmental factors. Some populations are very sensitive and have a narrow tolerance range, whereas others have a wider tolerance for the same environmental factor (Figure 2).
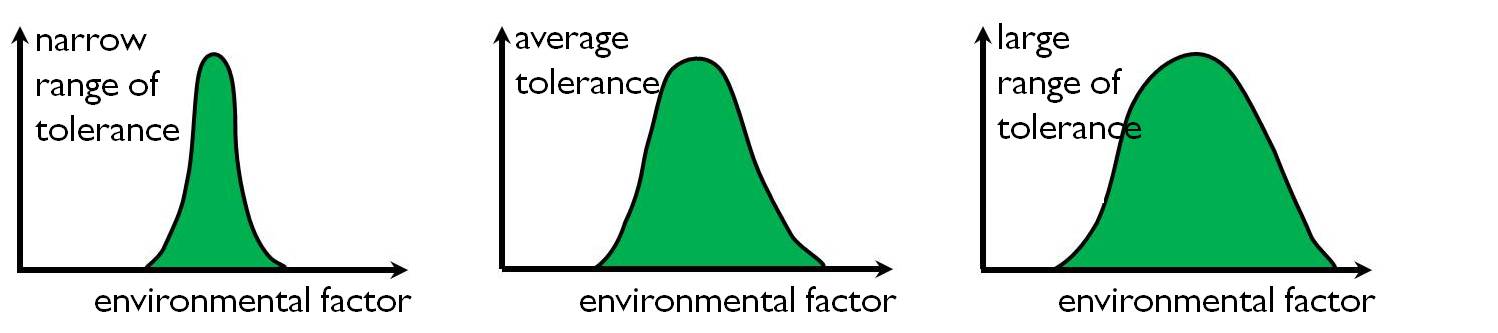
Figure 2: Comparison of different tolerance ranges to limiting environmental factors
When plants have a narrow tolerance range to several environmental factors, they are considered specialists, because their occurrence and long- term survival depends on very specific environmental conditions.
Specialist species are indicators of the environment, because their presence (or absence) indicates specific environmental conditions. For example, in peat bogs plants live in cool humid microclimates, developing on substrates of low pH that also lack dissolved inorganic nitrogen. Even without measuring these parameters we know that the presence of species such as the Purple marshlocks (Comarum palustre (syn. Potentilla palustris) and the Round-leaved Sundew (Drosera rotundifolia) indicate very specific environmental conditions.
Generalist species have a large tolerance range to many environmental factors, which explains why they occur in so many different environments. Widespread weed species such as the Black locust (Robinia pseudoacacia) and the common Couch grass (Agropyron repens (syn. Elymus repens)) are generalists.
If different species have similar ecological requirements and similar tolerance ranges (i.e., collective tolerance), they belong to similar ecological groups of species. Ecological groups have been established for similar temperature, water and soil pH requirements, and can provide information about the ecology of habitats (see Simon T. 2001, Vascular Flora of Hungary).
Environmental factors can be divided in two major categories: abiotic environmental factors, such as water, light, temperature, soil nutrients etc. and biotic environmental factors (all other organisms and populations with which organisms interact). Every population (and individual) is affected in some way by the presence of other populations of the same habitat, especially when two-way or one-way relationships develop.
6.2. Abiotic environmental factors
6.2.1. Light
Light is the source of energy for all autotrophic plants and nearly all ecosystems (which are energetically open systems because they need energy input). Only some cave ecosystems and deep marine habitats are exceptions to this, in that their source of energy consists in chemical substances and not light.
The sunlight is a portion of the radiant energy visible to the human eye. The entire electromagnetic spectrum consists of waves of different lengths:
-The short wavelength radiation (λ <380) is called ultra-violet radiation (UV) and represents only 1-5% of the total electromagnetic spectrum. These waves are harmful for living organisms. They impede growth and cause death of the living cells. When penetrate the cells, the UV rays have mutagenic effects, causing burns and pathological alterations in plant tissues. The ozone layer in the Earth's stratosphere protects plants from UV radiation: without it, life on Earth would not be possible.
- Visible light (wavelenghts between λ: 380 – 720 nm) represent more than 50% of the global (total) electromagnetic radiation. When light passes through a prism, it is broken down to different colors. Each of this color has a certain wavelength: violet (λ =400–424 nm), blue (λ =429–491 nm), green (λ =491–575nm), yellow (λ =575–585nm), orange (λ =585–647), red (λ =647–700nm).
- The long wavelength radiation (λ > 720 nm) is called infrared radiation (IR) and represents 40-44% of the total electromagnetic spectrum. Infrared rays are not visible to humans, but are detected by the living organisms as heat.
- PAR (Photosynthetically Active Radiation) refers to the spectral range utilized by plants during photosynthesis. This value ranges between λ= 380–750 nm. The range of PAR and of the visible light overlap almost completely (Figure 3).
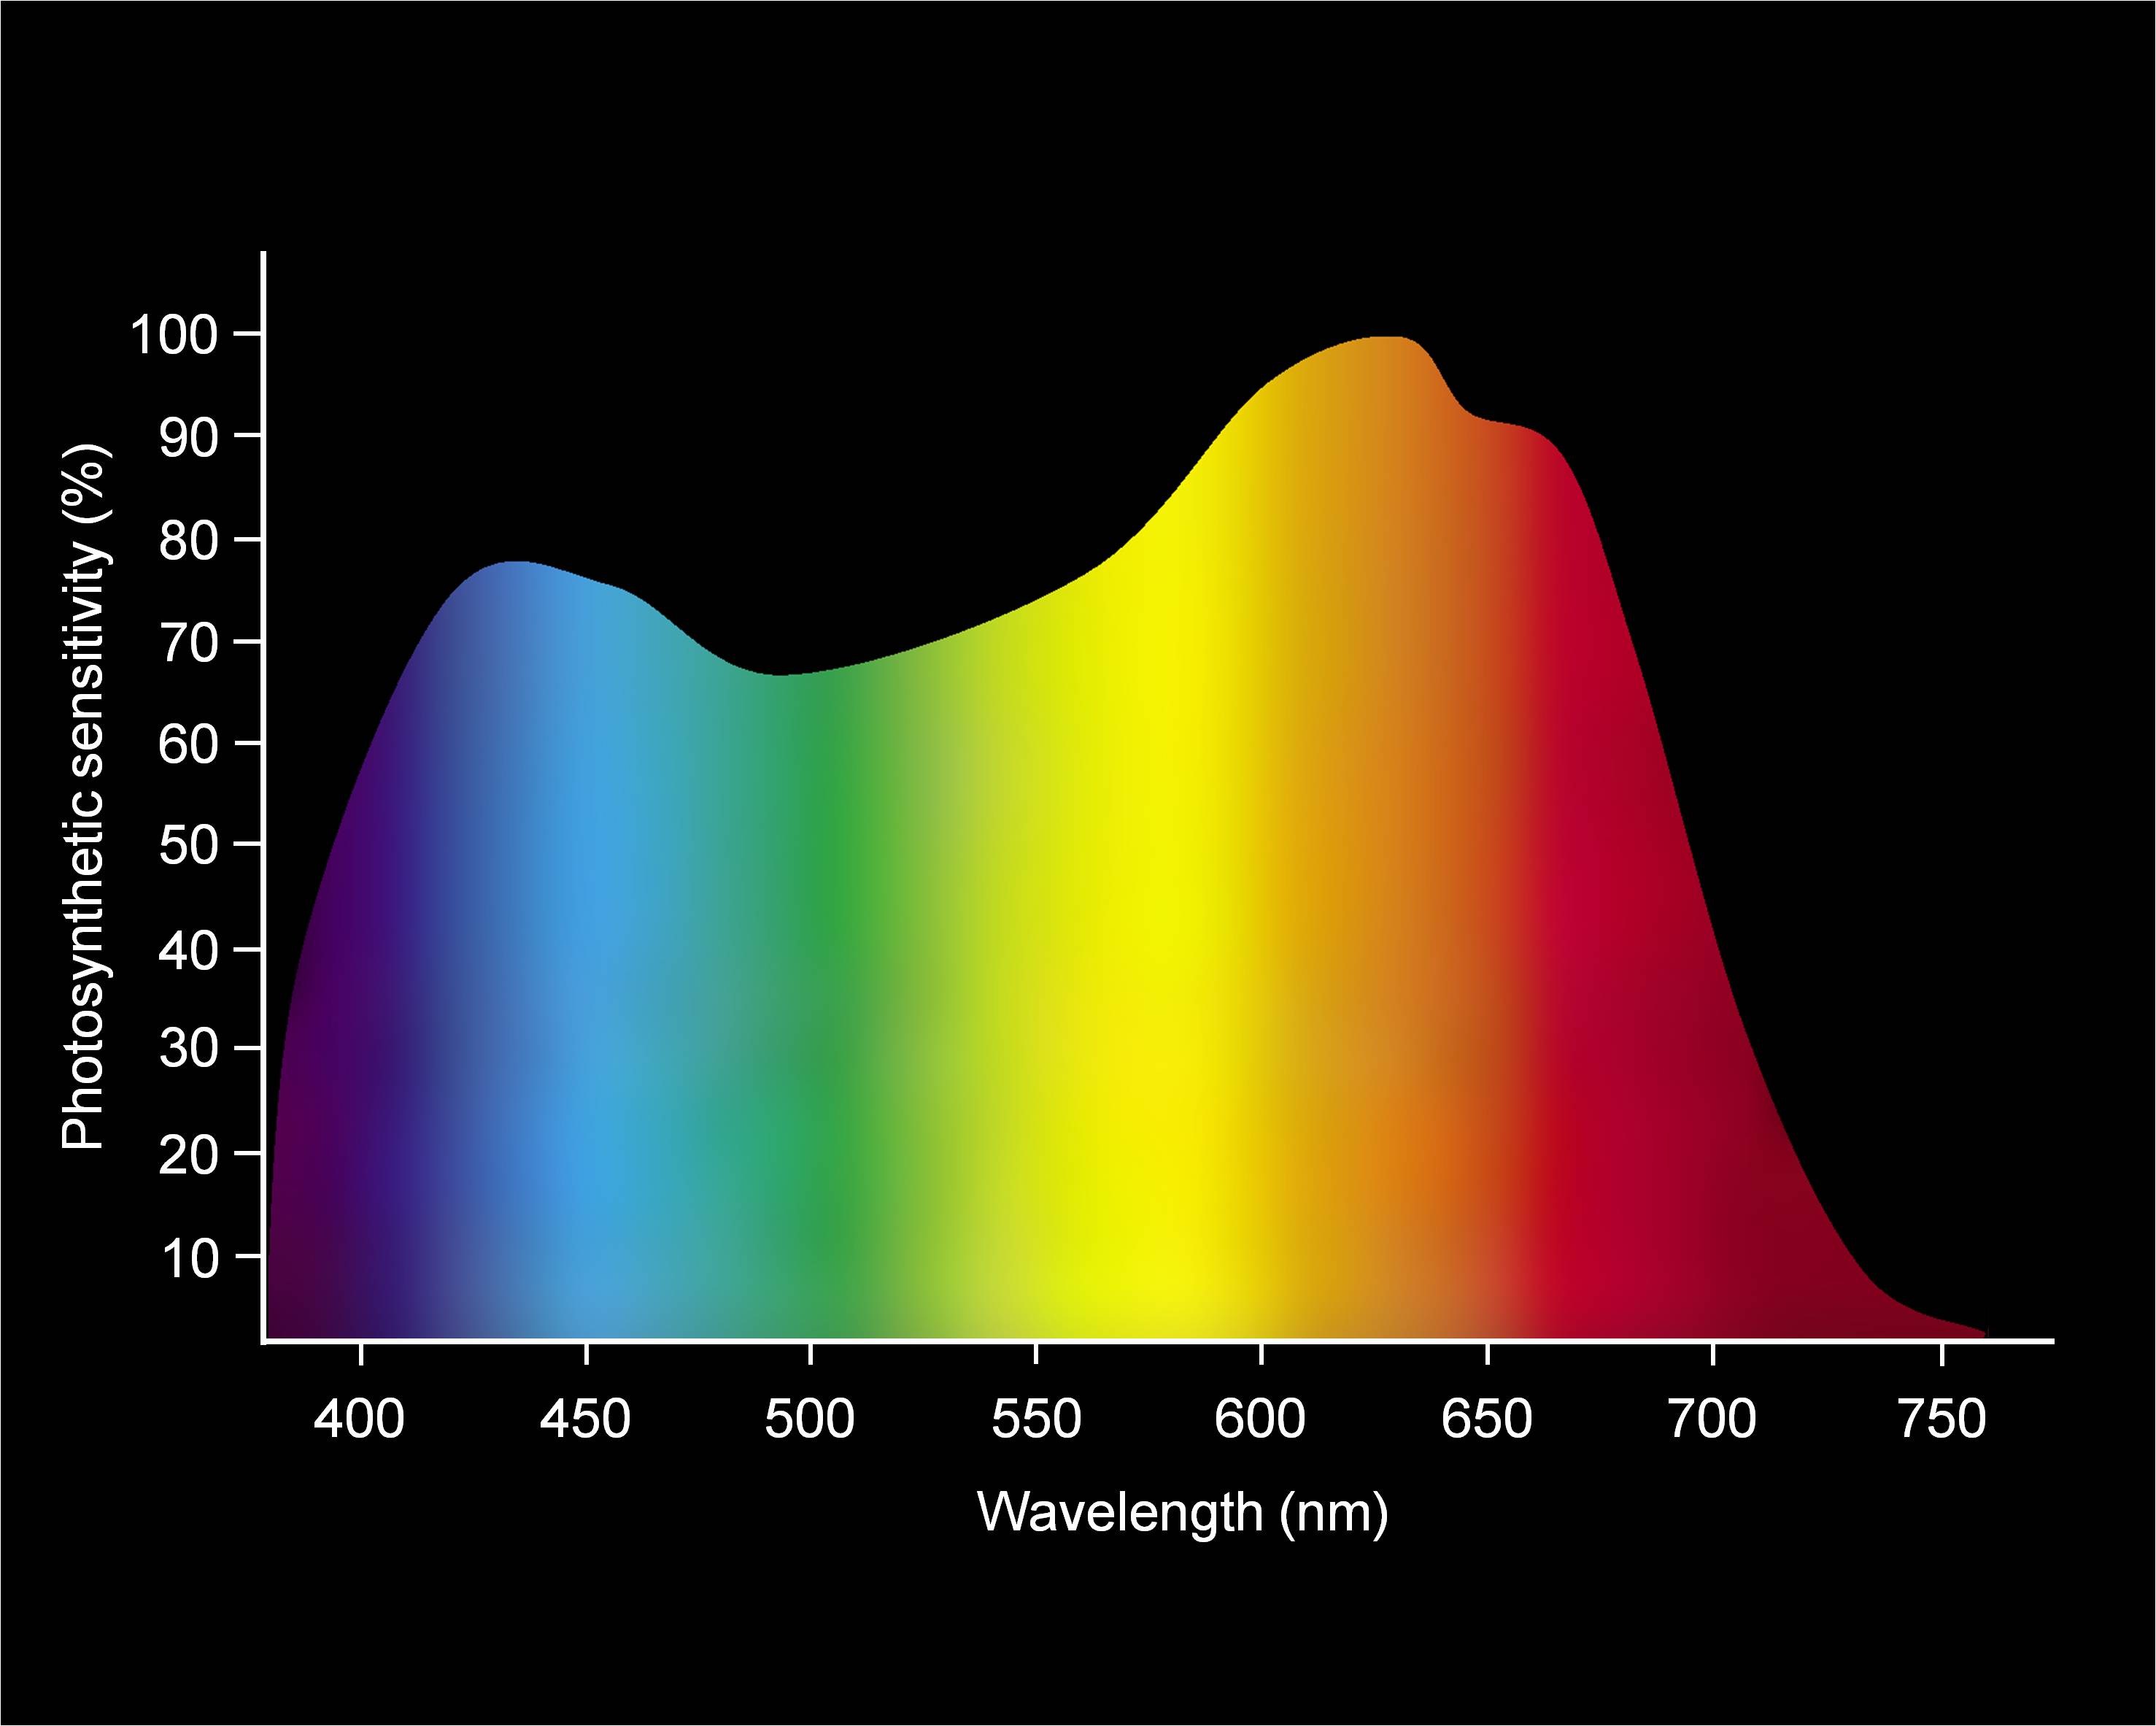
Figure 3: The Photosynthetically Active Radiation (wavelengths between 380 –720 nm)
The chlorophyll molecules of green plants utilize the red and the blue light during photosynthesis.
Diffuse light consists mostly of radiation of long wavelengths, which makes it more suitable for green plants because it does not burn the tissues.
The distribution of the light energy (i.e., the ratio between the direct and indirect light) on Earth varies seasonally and with latitude ( Figure 4).
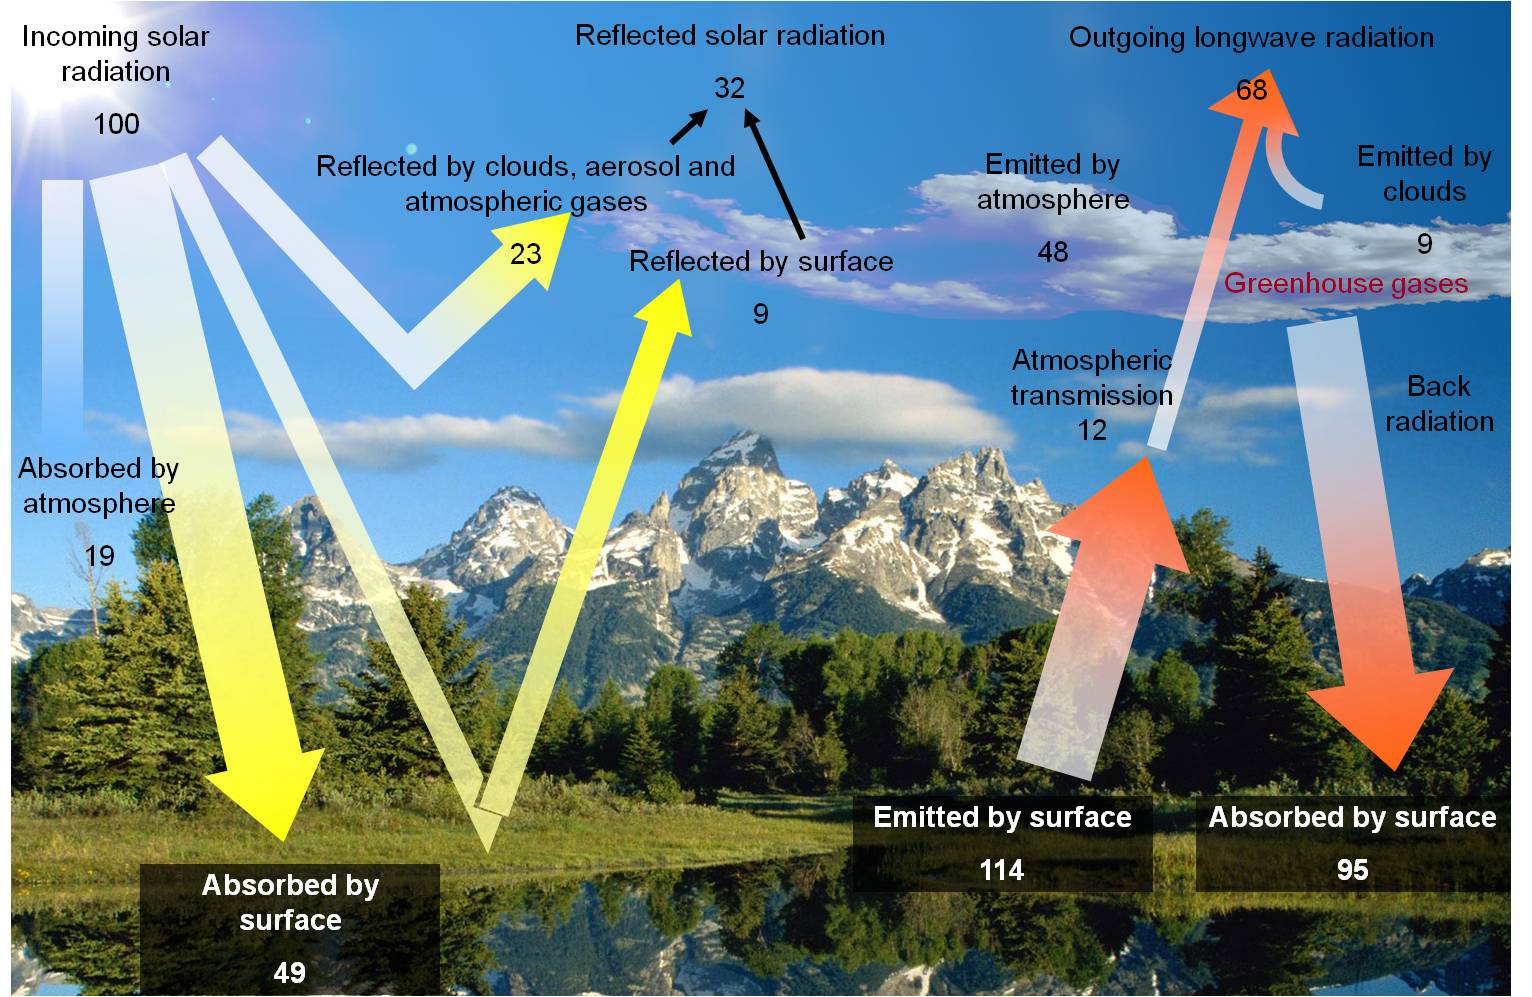
Figure 4 : Light and radiation on the surface of the Earth
(Cain, M; Bowmann, W. D.; Hacker, S. D. 2011)
The ecological significance of light and forms of adaptation
The ecological effect of light on plant populations depends on the intensity of light, the length of the exposure and also on the spectral composition of the light. All these features can affect plant populations and can trigger adaptation. The effect can be observed at the individual- and at community level.
The effects of light intensity
Light as an environmental factor cannot be stacked up: in contrast to other factors such as the water, plants cannot store it. Consequently, the process of photosynthesis starts whenever the light conditions are suitable, and stops every time when the light becomes too weak. When plants stop photosynthesizing, the primary production of organic matter also stops. The intensity of photosynthesis increases with increasing light intensity, but up to a certain point. Using experimental approaches we can draw the photosynthesis light response curves (the effect of increasing light intensity on the rate of photosynthesis), and based on these curves it is possible to determine the light requirement of individual plant species or populations. The light response curves of different species can be compared with each other. The curves of species that require more intensive light (high-light plants) will saturate at higher levels than the curves of species that require lower light intensity (low-light plants) (Figure. 5).
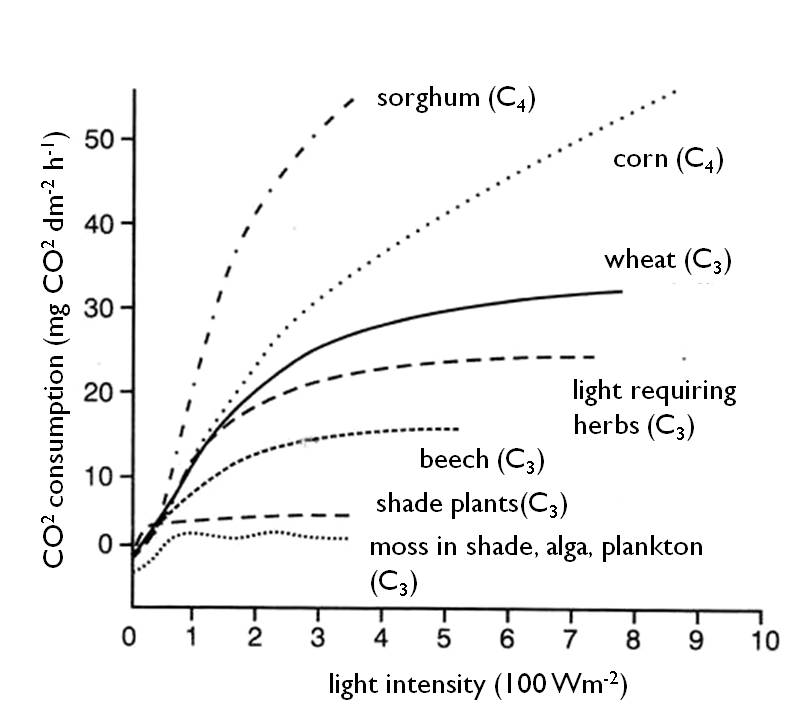
Figure 5 : Photosynthetic light response curves (CO2-assimilation curves) (Credit to Láng 2007)
Insufficient light causes a number of symptoms in plants: chlorosis (they become pale), elongation (etiolation), thin cell walls. The anatomical structures of leaves may also change, the number of chloroplasts in the cells decrease (see: Chapter 3 for more details).
To reach diffuse light or to defend themselves from strong solar radiation, plant organs can “move”. This is called phototropism (the directional growth determined by the direction of the light source), and has been observed on a number of trees, shrubs and herbaceous plants. The intensity and the angle of the incoming light usually act together to determine the shape of the plants. Most of us have probably observed the phenomenon of phototropism on indoor plants, (uneven or one-sided growth when plants have more abundant window-facing leaves and branches) (Figure. 6 ).
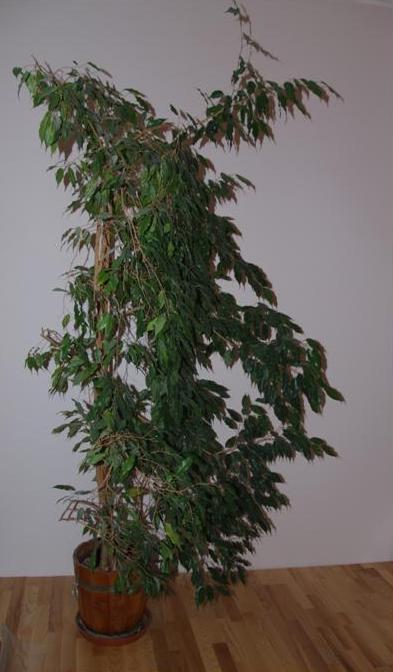
Figure 6 : One-sided growth of an indoor Ficus benjamina plant
In very dense forests trees often grow straight and tall and make few, short branches. When solitary in open areas, individuals of the same species develop wide crowns with expanded branches and the stems are shorter. At the edge of the forest, trees are often lopsided with fewer branches and leaves on the side that faces the shaded forest.
We have seen when we compared the photosynthetic light response curves that plants react differently to increasing light intensity ( Figure. 7). This is a result of adaptation to different light conditions within their natural habitats. Accordingly, plant species can be grouped by their light requirements as follows:
- Sunlight plants - Heliophytes -
All life processes require full sunlight. These plants live in open habitats such as rock grasslands, deserts, old fields and upland grasslands.
- Shade tolerant plants – Helio-sciophytes -
Tolerate the shade, but blooming is triggered by full sunlight. Some grasslands species and early spring plants of deciduous forests belong to this group.
- Shade plants - Sciophytes -
Full sun exposure is harmful, as these plants require low-intensity light for all life processes. These plants inhabit the understory of closed forests, ravines and steep valleys. Many shrubs, herbaceous species and ferns are sciophytes.
The intensity of light is therefore a key environmental factor. The value of light intensity where the rate of photosynthesis matches exactly the rate of respiration on the photosynthetic light response curve is called light compensation point. At this point, the uptake of carbon dioxide through photosynthesis equals the respiratory release of CO2. Its value indicates the requirement of plants for light. Heliophyte species have the highest light compensation point.
This value corresponds to the net photosynthesis expressed in calories (which equals the total photosynthesis minus the respiration consumption).
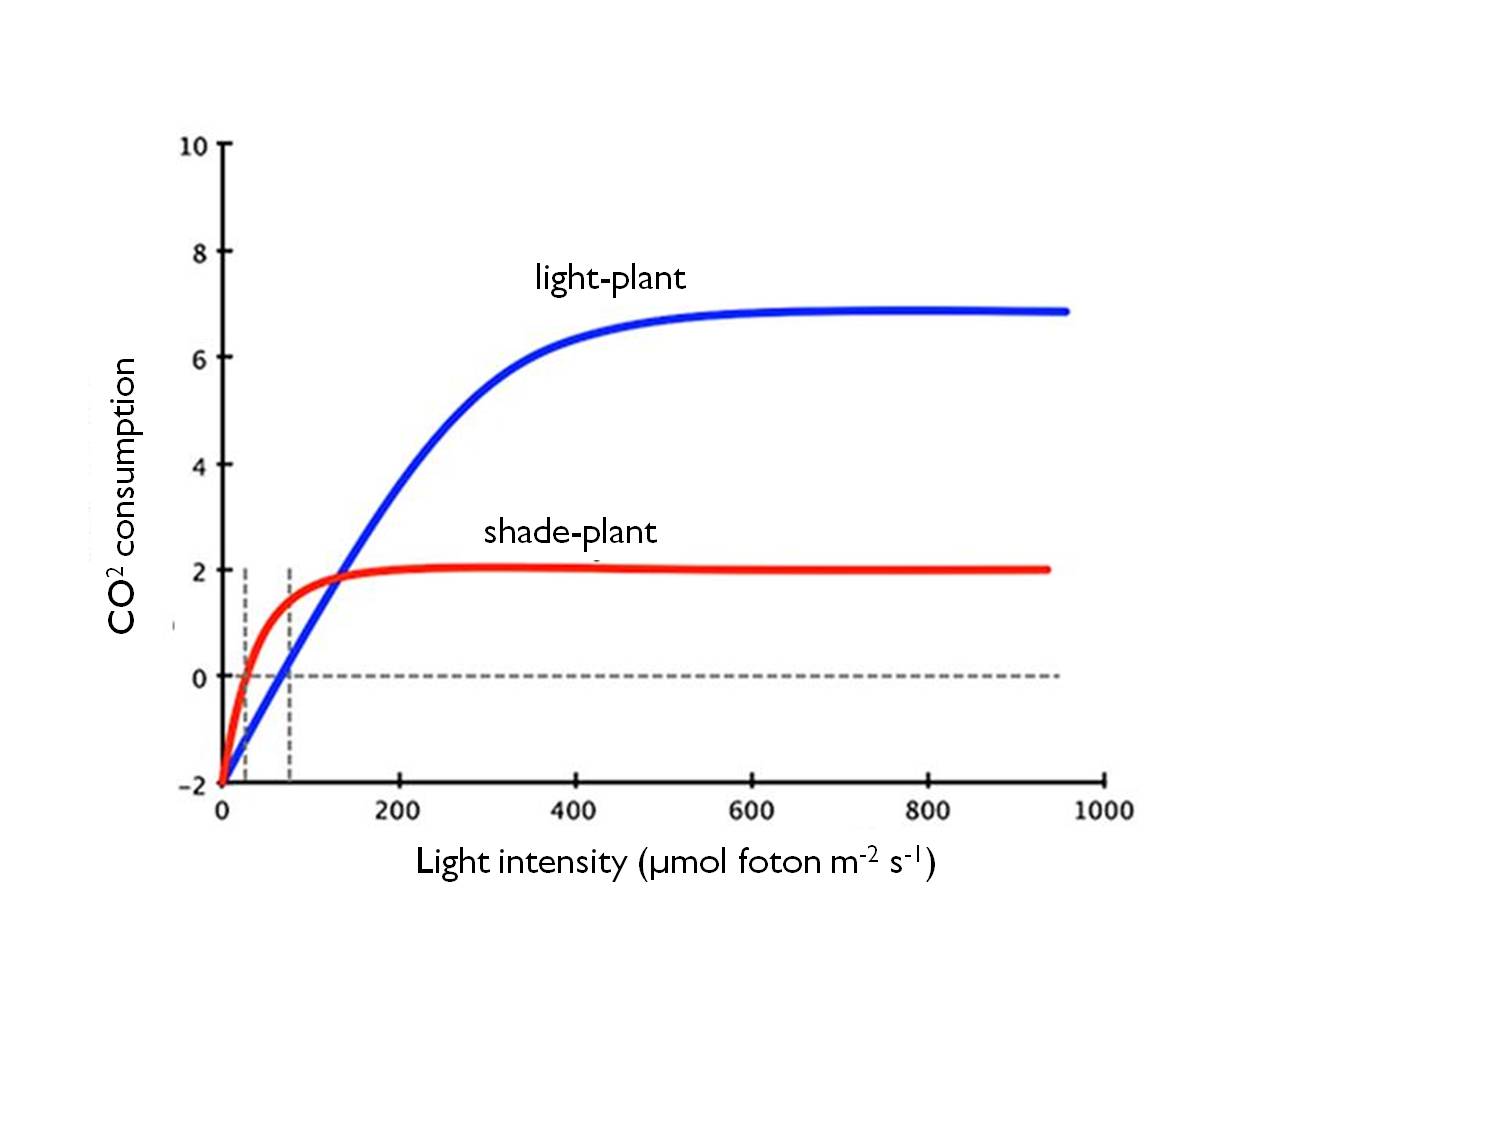
Figure 7 : The relationship between the light intensity and the CO2 uptake in shade- and sunlight plants.
The adaptation success also depends on the anatomical structure of plant organs. The leaves of a tree get different amounts of light depending on their position in the canopy, and as a result there can be shade- or light leaves on the same individual (see Chapter 3 for details). In the horticultural practice, an incorrect pruning can expose the inner foliage of a tree to strong sunlight, which can cause damage to the leaves and the tree can even lose all of its leaves.
Photoperiodism
Light conditions follow a seasonal periodicity in many parts of the world, and the number of sunny hours per day can have a strong effect on plant development. As a result of adaptation to light and dark periods, the life cycle of numerous plants is controlled by the duration of the daylight. Three groups of plants can be distinguished:
- Short-day plants are adapted to less than 12 hours of sunlight, and cannot bloom under long days. A long dark period is required to start the flowering process, and if the dark period is interrupted they will not bloom. Short-day plants originate from the tropical and subtropical regions (e.g., Chrysanthemum, Dahlia and Nicotiana species, some Euphorbia species).
- Long-day plants are adapted to more than 12 hours of light and can only bloom when days are longer than the nights. For example, 15-16 hours of light and temperatures of 15-21°C induce the development of the generative stems in poppy and lettuce. Blooming can also be induced using artificial light, which elongates the regular daylight conditions. These plants originate from the temperate zones and some of them even from north (e.g., oats, barley and carrot).
The effect of photoperiodism is commonly used in horticultural practices. Plants can require variable exposure to light during different developmental phases such as germination, flowering and fruiting.
- Day-neutral plants (light-indifferent plants) are not affected in the formation of their generative organs by the length of daylight (e.g.,cucumber, tomatoes) (See also Chapter 4).
The effect of spectral composition of the light
Light of different wavelengths can influence growth and development in plants. This is called chromatic adaptation. The red and orange light (the diffuse light) is beneficial to plants as it increases the net photosynthesis. In a rarified atmosphere e.g. on the mountaintops, harmful short-wavelength (UV) radiation can trigger specific morphological adaptations. Dark, often red leaf colors, few flowers, increased hairiness, short internodes and shingled leaves that cover each other provide not only cold hardiness but also UV protection.
Aquatic environments are an optically dense medium which strongly enhances chromatic adaptation in plants. This is best seen in algae. The chlorophyll is adapted to red light, and because the red light has long wavelength which is unable to penetrate deep in the water, green algae always live close to the shores in shallow waters. Xanthophyll pigments - such as brown algae’s fucoxanthin – absorb the green light, and therefore they can survive in deeper seas. Rhodophytes (red algae) grow in the deepest waters, because they are able to absorb the blue-violet light (of short wavelength, able to penetrate the deep waters).
Community -level effects of light
The light requirements and ability of different plant communities to capture light can be different and may depend on many factors. If we wish to estimate the light energy utilization (photosynthetic primary production) of a plant community, we have to calculate the Leaf Area Index (LAI), which is defined as the leaf area per unit ground surface (m2/m2). The LAI also permits the comparison of the light energy utilization across different plant communities.
6.2.2. Temperature
Organisms detect infrared rays (the long-wavelength range of the solar radiation, λ> 720nm) as heat. However the air temperature is not directly determined by the atmospheric radiation, because first the soil absorbs most of the heat and then the reflected heat warms up the air. As a result, the average air temperature decreases with higher elevations. This explains why the temperature of individual habitats is basically determined by the surface albedo (reflection coefficient) i.e., the ratio of the absorbed and reflected radiation from the Earth’s surface. As with the light, the temperature is also affected by the angle of incoming solar radiation and the exposure and the angle of the slope.
Temperature in the cities can be higher with several degrees than in the neighboring natural habitats because the heated buildings, pavements and walls reflect back the radiation. The polluted air of high CO2 content is also warmer than the surrounding areas (greenhouse effect).
The temperature affects the life cycle of populations, the growth, flowering and fruiting. In plants, almost all life processes have an optimum temperature requirement –e.g., there is germination temperature and flowering temperature. The key factor of a successful plant production is to ensure the optimum temperature for every phenophase of the cultivated plants.
The heat energy is therefore a key environmental factor. The temperature value where the amount of organic matter produced by photosynthesis compensates for the loss of energy through respiration is called temperature compensation point.
Another important indicator in crop production is Szeljanyivov's growing seasons heat sum, which is the sum of the daily mean temperatures during the growing season. This value shows the amount of warmth needed for the crops to grow and develop, expressed in °C. The suitable period for horticultural production in Hungary is between the end of April until the end of September, and the heat sum is 2900°C-3300°C. If a plant’s heat requirement is higher (such as for the citrus), the plant cannot be cultivated or if so, only under special conditions in a greenhouse. In comparison, the heat sum for the red pepper is about 3000°C, therefore it can be grown nearly everywhere in Hungary. Although at the beginning of the growing season from sowing to germination the amount of heat needed for the red pepper is 250C°, the cultivation should be started in a greenhouse because early frost can harm the plants.
Plants in the temperate zone are adapted to the cold season, and as a result they may require a cold period for growing.
Extremely low and extremely high temperatures represent stress factors for plants, and therefore they try to avoid- or prevent the effect of this environmental stressor. Heat stress can damage the enzymes and the cell membranes. To avoid overheating, plants react by increasing their transpiration or by orienting leaf blades away from the incident solar radiation (e.g., the Eucalyptus). This is called panphotometric reaction. Adaptation can also be manifest at cell level, when plants produce and accumulate heat shock proteins.
A similar phenomenon can be seen when plants defend themselves against cold. As with the heat, frost can also damage the cell membranes and frozen water also results in physiological drought. In addition, ice crystals can cause severe physically damage to cells. Plants defend themselves by cold tolerance or cold avoidance. In the first case, plants prevent the formation of ice crystals by increasing their metabolism to produce heat, and in the second, by increasing the concentration of "antifreeze" compounds (sugars, amino acids). Some species can withstand the formation of ice crystals by, for example, withdrawing the water to the apoplast (cell wall region of plants as well as intercellular spaces and dead cells without cytoplasm) just before freezing, or producing special "antifreeze" proteins that prevent the formation of ice crystals.
Plants of cold climates show both morphological and physiological adaptation to extremely low temperatures. Cold winds and low temperatures are avoided by specific dwarf growth which is very advantageous in terms of heat management (Figure 8).
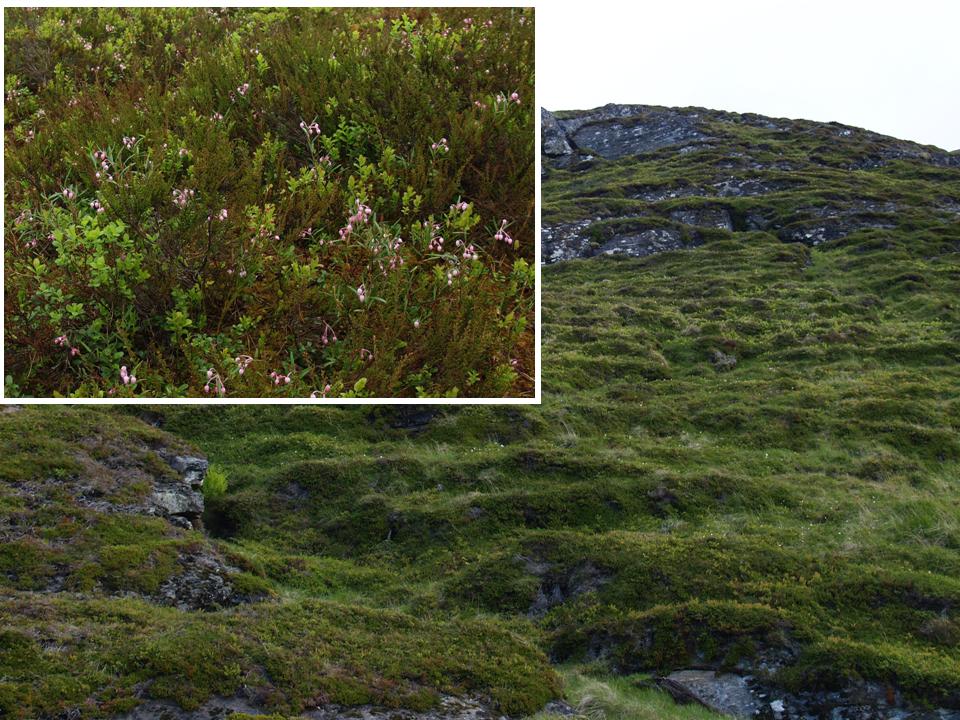
Figure 8 : Dwarf-shrub vegetation in the arctic tundra: blueberry species (Vaccinium), Heather (Calluna vulgaris) and Bog rosemary ( Andromeda polifolia)
6.2.3. Water
Water is an essential environmental factor for plants. Water under all forms (ground water, precipitation, vapor, frost) influences tremendously plant populations. Water availability is always critical to plants.
The physiological and ecological role of water is complex:
- it is the medium in which biochemical processes (e.g., enzyme activity) take place, it is also a solvent and a reagent (e.g., in hydrolytic processes, photosynthesis);
- it is the starting chemical compound in photosynthesis: following the splitting of water mollecules, the hydrogen is incorporated in primary organic matter;
- it controls the turgor pressure in plant cells (i.e., the stiffness of the cells);
- it is a regulator of the osmosis involved in the nutrient transport processes;
- it plays an important role in temperature control, as evapo-transpiration cools down the plant tissues;
Having access to water has been a big challenge for plants when they stepped out to the mainland from the ocean environment. The amount and distribution of rainfall across the mainland habitats is a key factor that has controlled plant life ever since.
The water regime of plants
Mainland organisms such as the higher plants had to adapt to uneven water supply. Poikilohydric plants depend entirely on the presence of water, they have no mechanisms to prevent desiccation. At drought they dry out and their life processes stop. Such are the mosses and the lichens, who take up water through the whole body surface. The cushions in which mosses grow can hold back the water resulted from precipitation for a long time.
Homoio hydric species have developed their own water regime, which ensured their success under terrestrial life conditions. The water regime of higher plants can be independent from the environment for short periods of time. Water uptake does not happen through the whole body, but specialized organs, the roots. Both the water uptake and the water release are controlled processes. Ferns and flowering plants are homoiohydric plants.
As a result of adaptation to the variable amount of water available, plants can range from water-demanding to drought-tolerant plants.
Classification of plants according to their need for water
- Hydrophytes: plants from aquatic habitats, with bodies submerged entirely of partially in water. Some aquatic plants perform photosynthesis within the water (e.g., the submerged seaweed), others in the air (in which case the leaves spread out on the surface of the water, e.g. in water lily, Nymphaea sp.). Many hydrophyte plants have large intercellular spaces and channels in their tissues, called aerenchyma (Figures 9, 10).
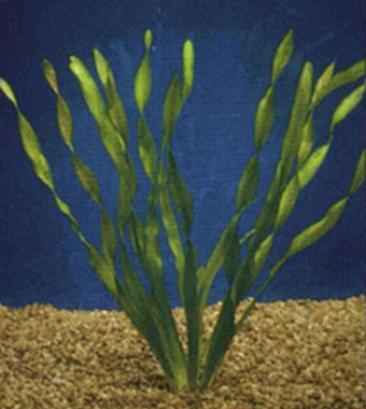
Figure 9 : Vallisneria spiralis
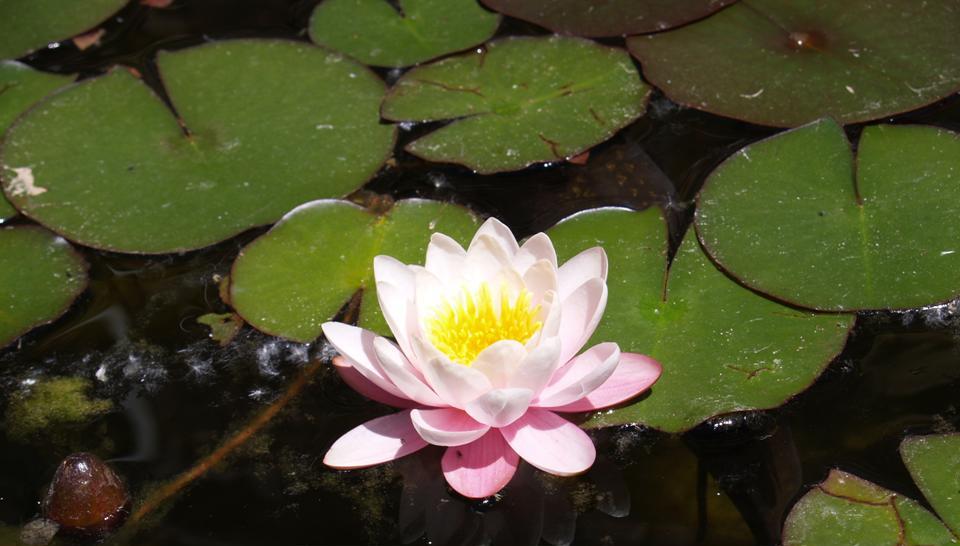
Figure 10 : Nymphaea sp.
Species rooted in the mud and with shoots rising high above the water are known as hygrophytes. Sedges(Carex), rushes ( Typha) and the reed (Phragmites) belong to this group. (Figure 11).
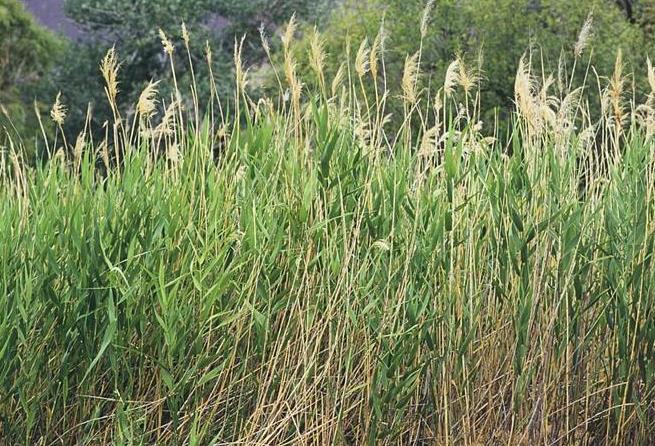
Figure 11 : Phragmites australis
Aquatic plants are often characterized by a large number of open stomata. Trees growing in water produce breathing roots that stick out of the mud, making possible the root respiration. Other features of hygrophytes are their thin leaf blades with little parenchyma and support tissue, large intercellular channels, stomata on both sides of the leaf (amphistomatic leaf) and often raised. Hygrophyte plants are able to rapidly evaporate the water and to remove excess liquid water as drops. The exudation of water drops is called guttation (Figure 12).
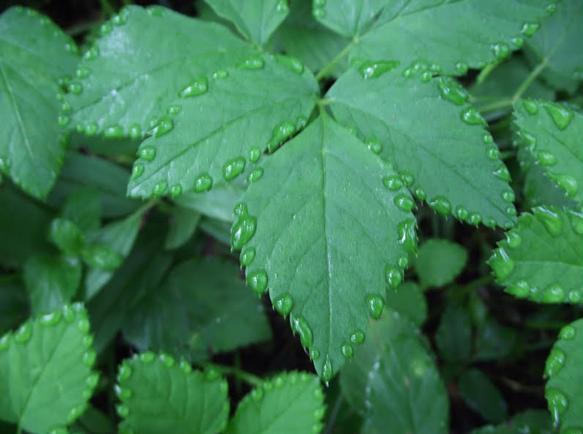
Figure 12 : Guttation (http://vadregeny.blogspot.hu/2012/08/kekturazas-zemplenben-2-nap.html)
- Mesophytes: species with intermediate water requirement, inhabiting soils of good water supply (Figure 13). Most of our agricultural and horticultural plant species belong to this group.
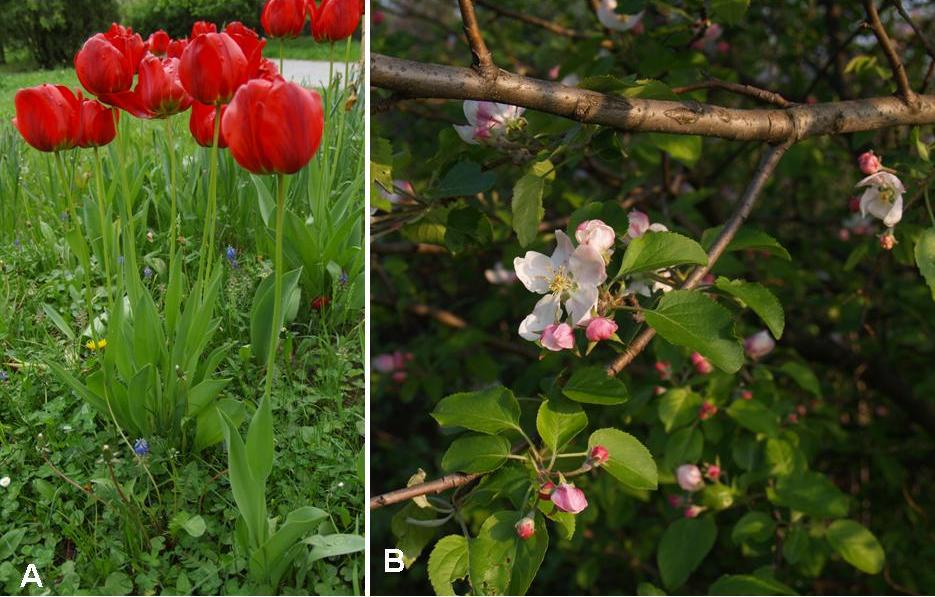
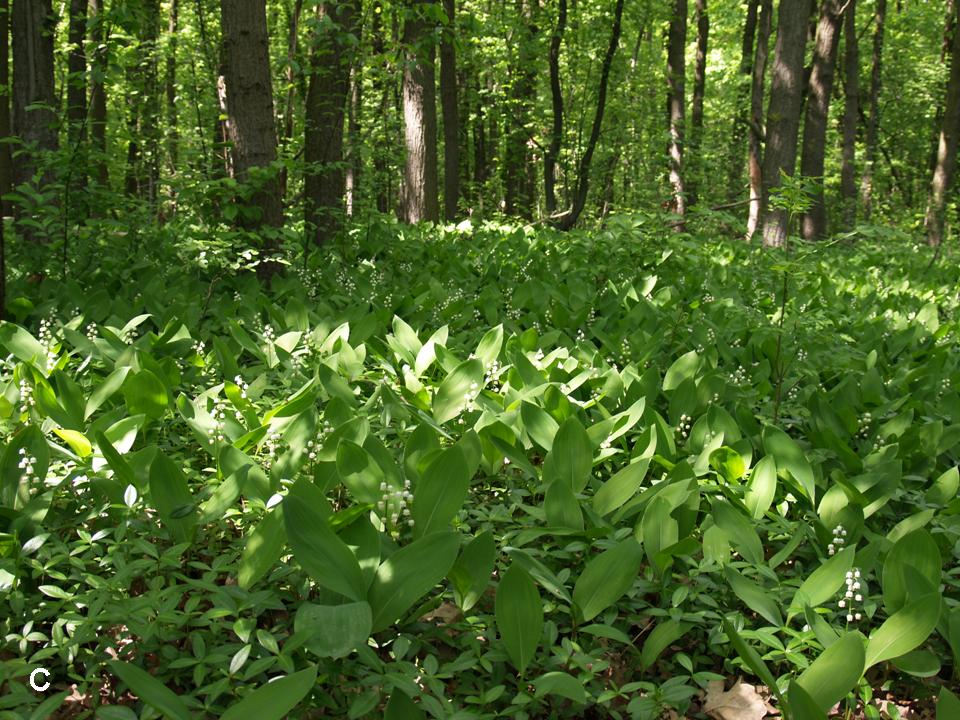
Figure 13 : Tulip (Tulipa hybrida) (A), apple (Malus domestica) (B), and a view of a Convallario-Quercetum roboris forest (C)
Plants are forced to adapt to drought. They will never prefer, just tolerate the drought if they have to. Xerophytism (drought tolerance) in plants has triggered very diverse morphological, physiological and ecological adaptations.- Xerophytes: drought-tolerant plant species, exposed to shortage of water for shorter or longer periods of time. Arid habitats are inhabited by drought- tolerant species.
Adaptation to xerophytism
- Morphological-anatomical traits: defoliation, modification of leaves into thorns, abundant hairiness (trichome cover), small leaf area, leaf rolling and curling, sunken stomata (stomatal crypts), deep root system (Figure 14).
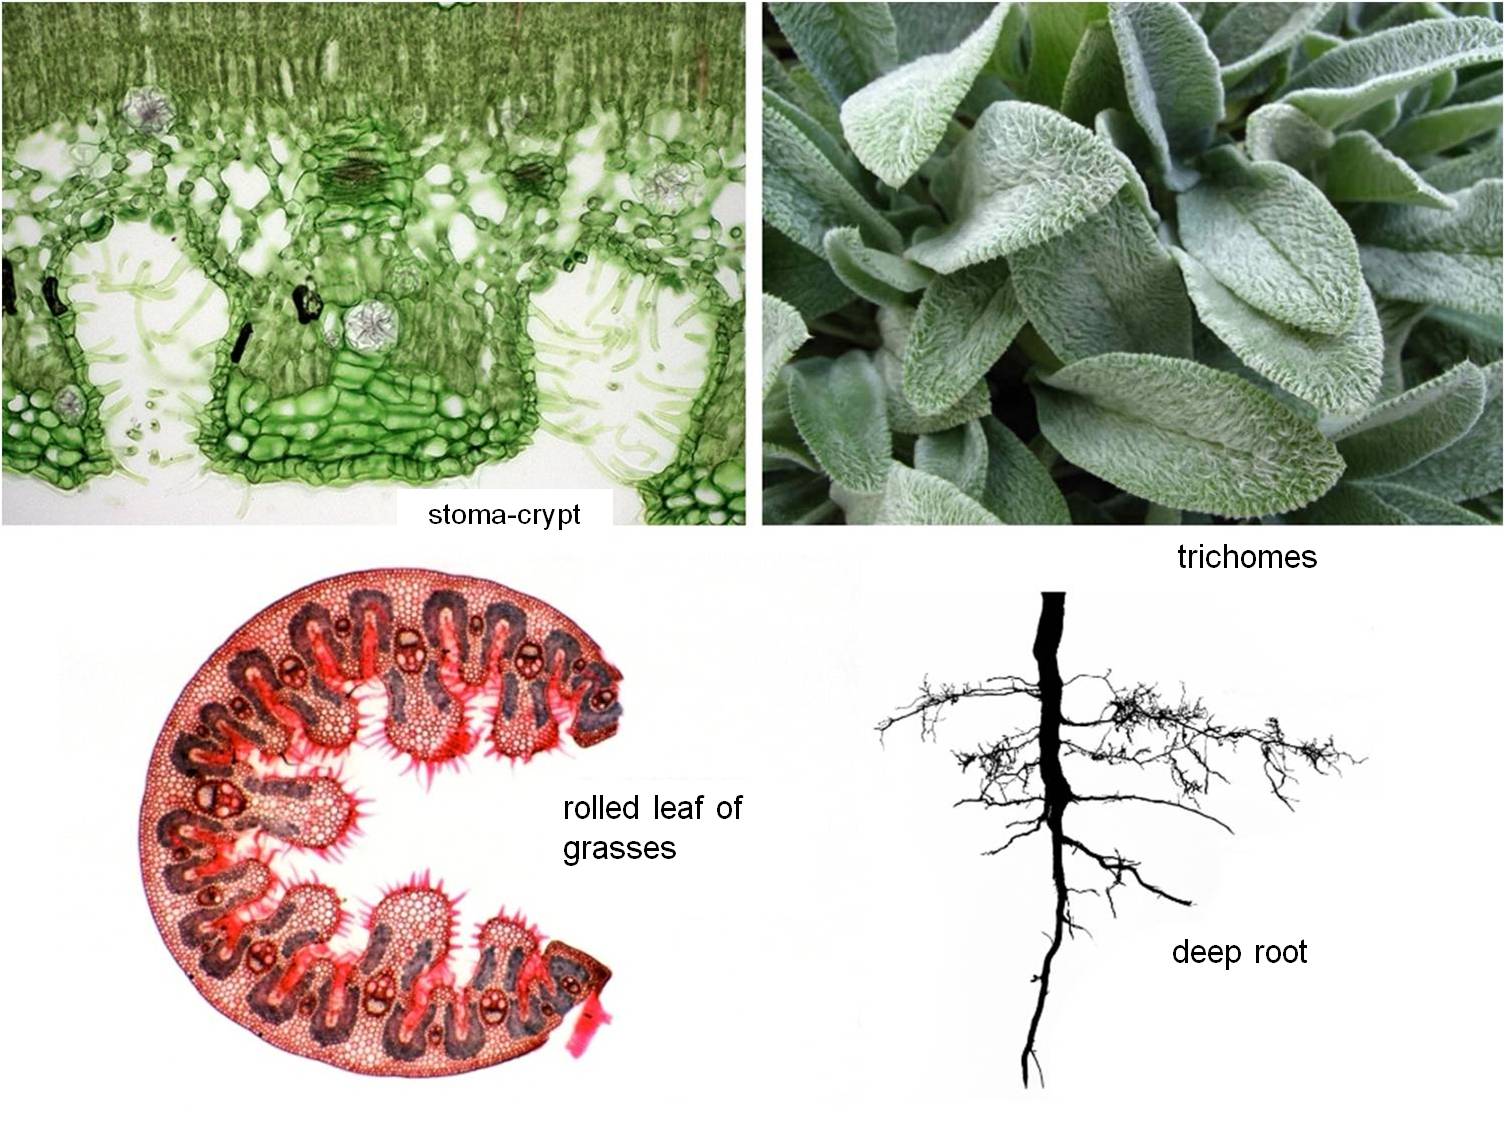
Figure 14 : Adaptive morphological-anatomical features to drought
A special form of water retention in plants is the succulence. Different organs such as leaves or stems can become succulent by retaining water in their tissues (Figure 15).
Figure 15 : Leaf succulents (A., Agave sp.) and stem succulents (B., Opuntia sp.).
- Physiological adaptations
In warm and dry habitats the evapo-transpiration increases during the day because of the high temperatures. A physiological challenge for plants consists in the fact that during the CO2 uptake for photosynthesis stomata must be open. But plants usually close their stomata to prevent water loss by evaporation, which means that carbon dioxide uptake is greatly reduced. This difficulty is solved by an alternative photosynthetic pathway evolved in plants of arid habitats, the CAM (Crassulan Acid Metabolism) type of photosynthesis found in e.g., desert succulents. During the night they take up CO2 which is stored in vacuoles under the form of organic acids. During the day when photosynthesis starts, the stored carbon dioxide is fixed the "traditional" way (the Calvin cycle), but with closed stomata (Figure 16).
Plants with the C4 type of photosynthesis followed an alternative adaptive way to drought tolerance. They developed new anatomical structures (for details see chapter 3). In C4 plants the CO2 molecules are embedded in a four carbon molecule, unlike the C3 plants where the first product of photosynthesis is a three carbon molecule (C3 photosynthesis). This four carbon molecule product is transferred to the photosynthetic cells where the carbon molecule is released and utilized in the Calvin cycle. The advantage of the C4 type of photosynthesis is that many cells can produce four carbon molecules as intermediate products, which are then accumulated in a single cell. The procedure is actually a type of carbon-concentrating mechanism, which means that the critical concentration of CO2 needed in the dark phase of the photosynthesis is made available to plants even with closed stomata (Figure 17).
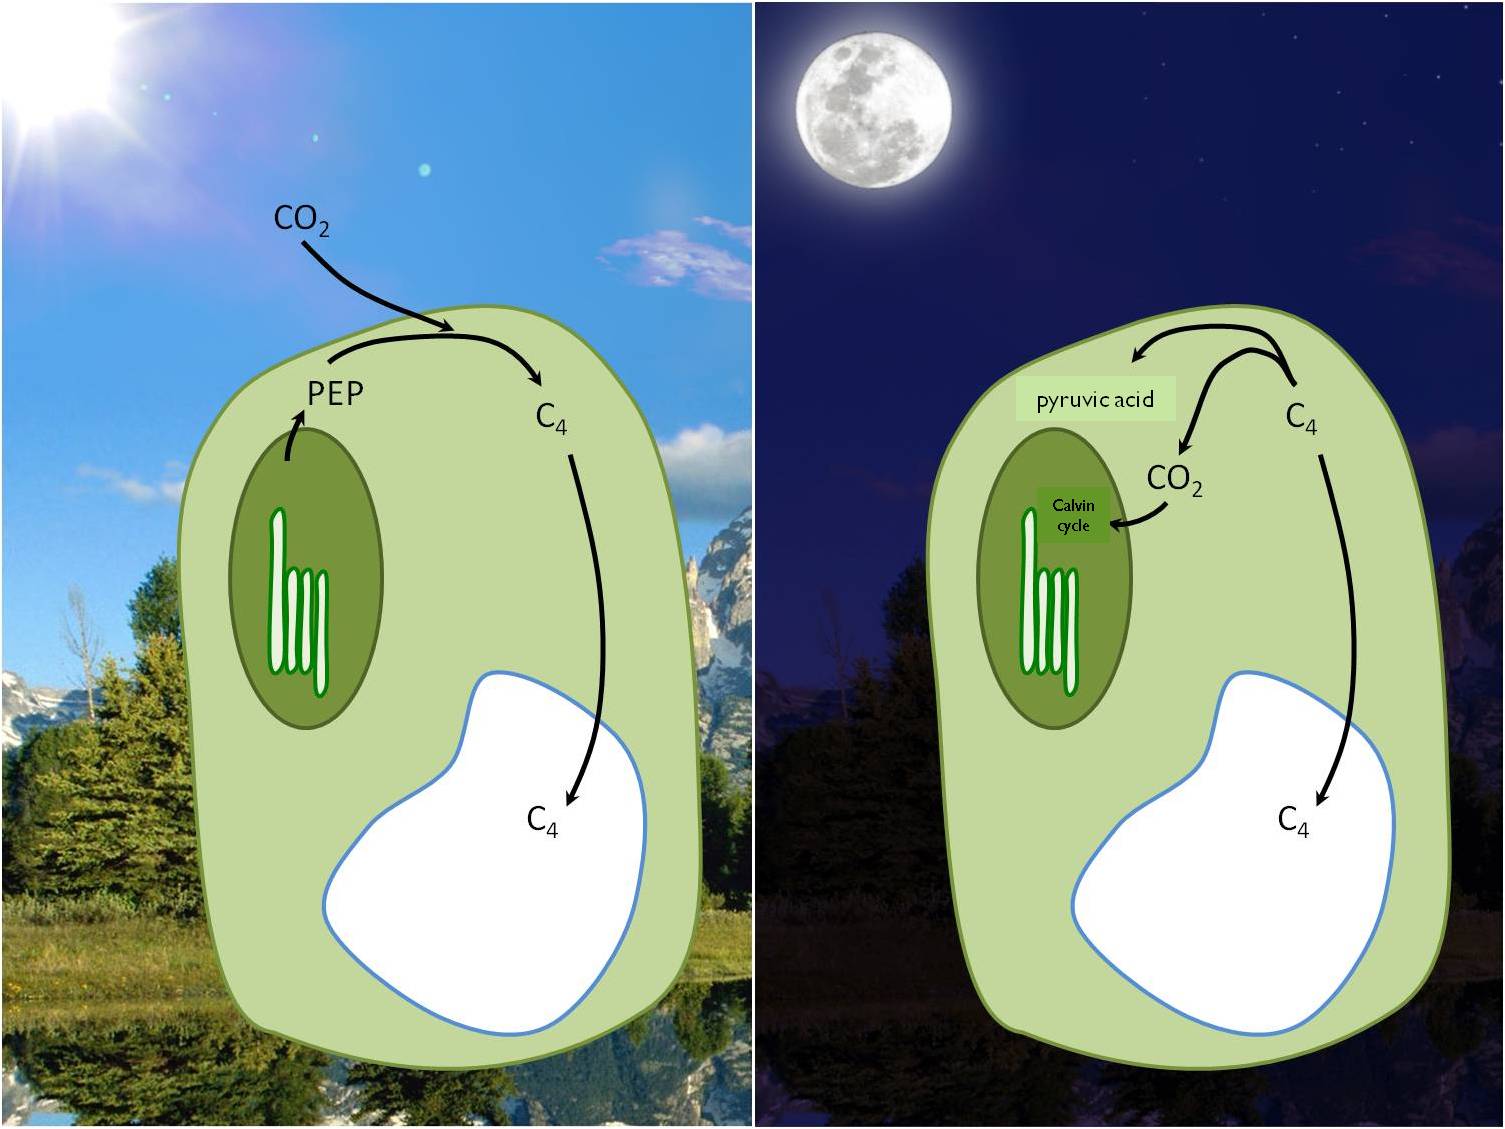
Figure 16 : CO2 assimilation in CAM plants (from Erős- Honti Zs.)
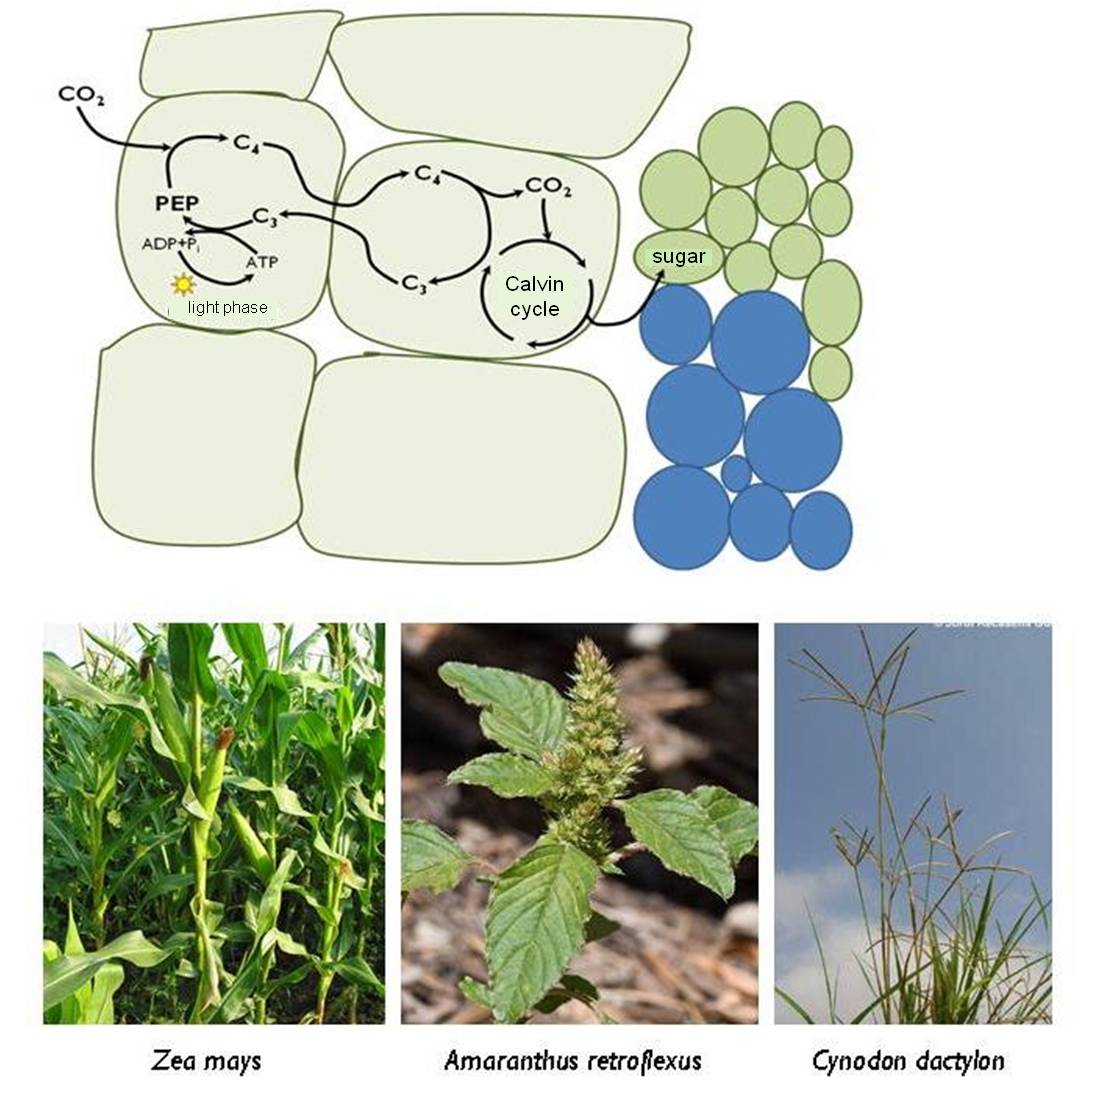
Figure 17 : Carbon fixation in C4 plants and C4 species
The C4 photosynthesis is not a common phenomenon in the plant kingdom, only about 1000 flowering plants, especially annual species were able to develop this photosynthetic mechanism.
Other forms of adaptation to drought are discussed in Chapter 3.
Life forms
Water shortage leads to decreased plant activity (dormancy) in plants. Dormancy may be induced when water is not available to plants for longer periods of time due to seasonal drought or because in the cold season freezing decreases water availability. Seasonal dormancy is common in arid habitats of the Earth and in the temperate and cold climate zones.
Plant life forms refer to the growth forms of plants, i.e. the different strategies to survive adverse environmental conditions. The best known life form categories were envisaged by Raunkiaer, and are based on the position of the dormant buds (Figure 18).
Annual species can survive the adverse periods in seed, in which case the bud is represented by the plumule of the embryo.
Perennials have developed very diverse life forms. Woody plants keep their buds alive aboveground whereas herbaceous plants can have buds close to the ground or hidden in the soil.
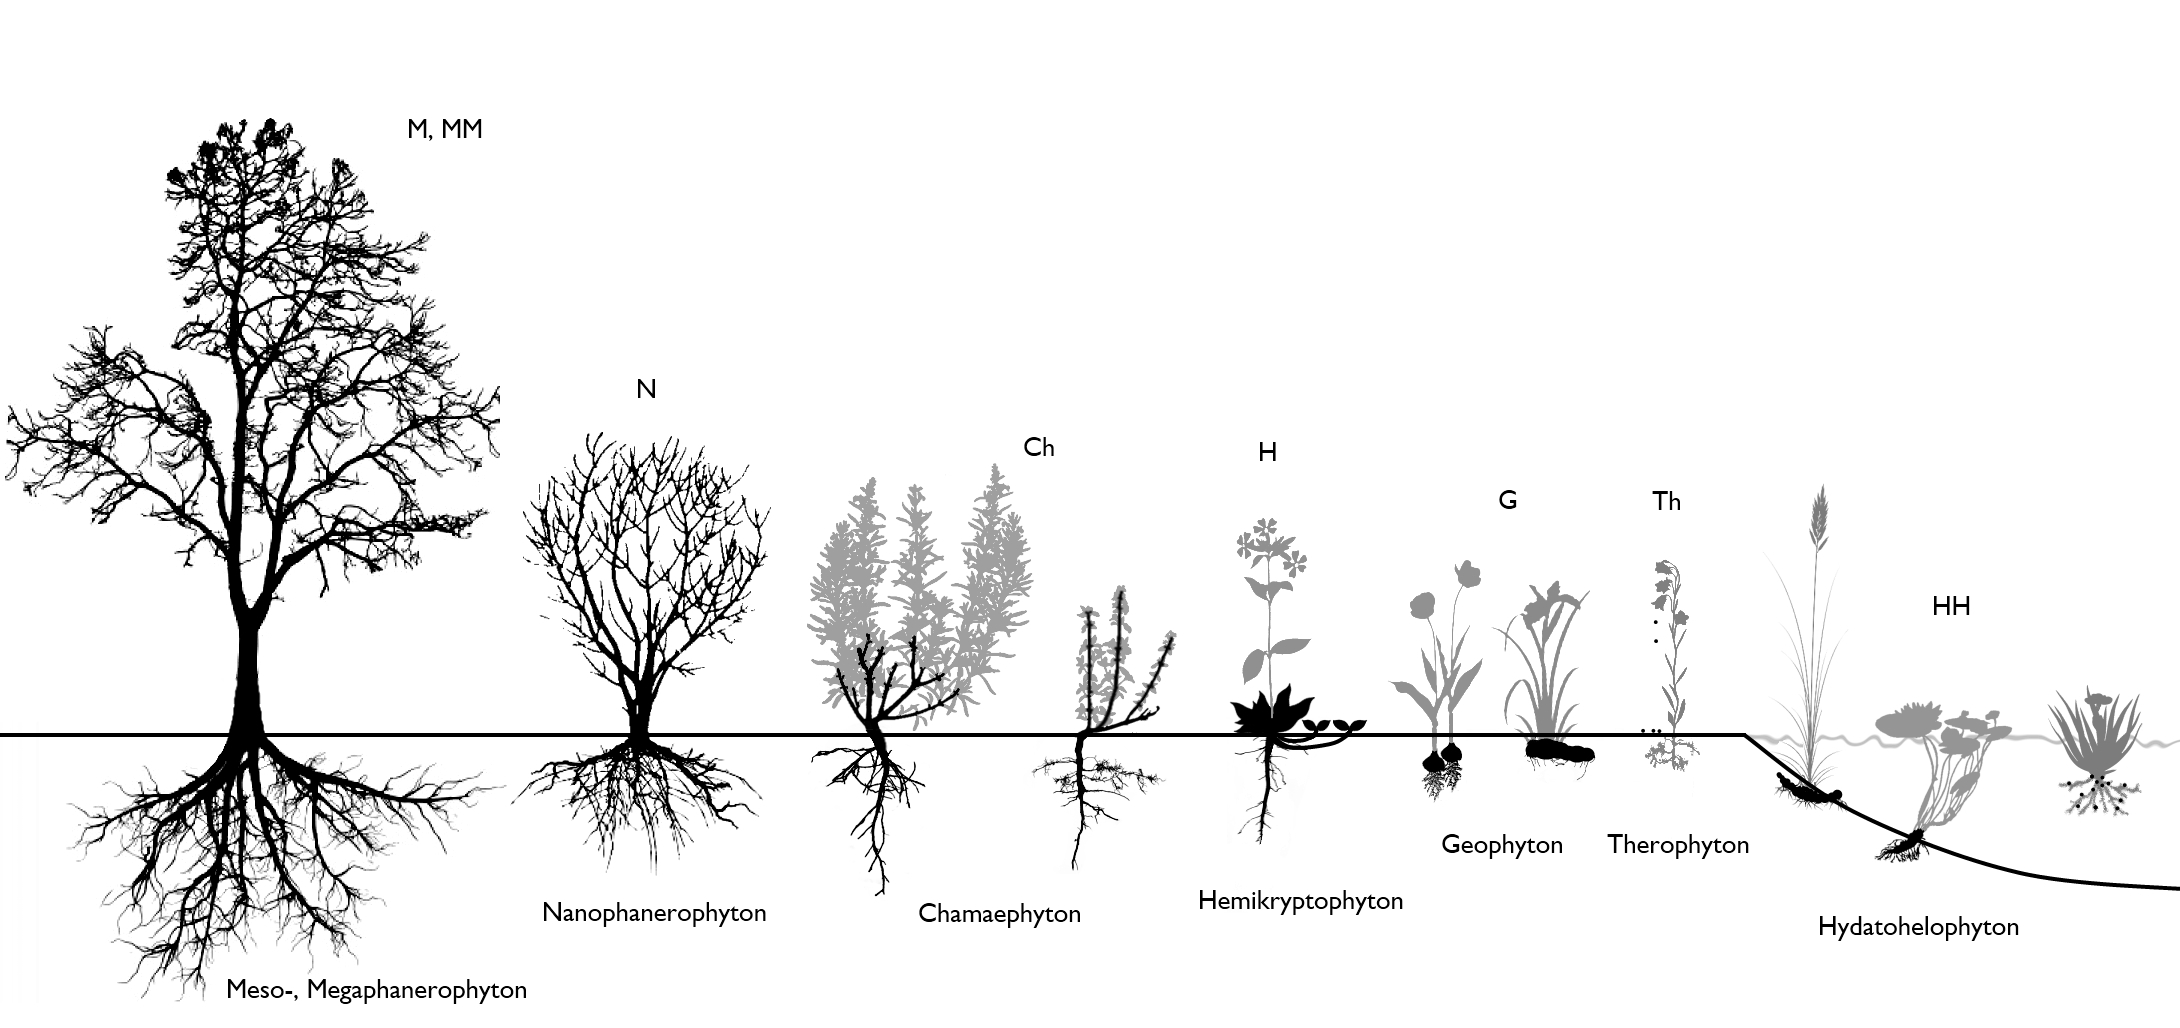
Figure 18 : Raunkiaer's life forms. Darkened parts indicate the position of the dormant buds.
Community-level adaptation to water shortage
The vegetation structure of dry habitats often reflects the efforts of populations to withhold water. After hot summer days only small amounts of morning dew form, but even that can be used by some plants. Cushion plants are able to retain and absorb it by the dew roots that grow on the ground. Shrubs in arid, semi-desert habitats have low, compact and spherical growth with shoots angled to lead the early morning dew to the base of the shrub. The flowering and seed dispersal starts after or during the rainy season. In desert habitats and in perennial dry grasslands usually all species bloom massively at the same time.
A long dry season can also trigger dormancy. For example, in the Mediterranean region many herbaceous species are forced to dormancy twice a year, first because of the summer drought and second, during the winter.
6.2.4. The soil
The soil is one of the most complex components of the ecosystems, and as the Earth crust’s uppermost and fertile layer it plays a determinative role in the distribution of plants. The soil is a limiting factor for each of the terrestrial plants, it keeps plants fixed in the ground and it is an essential source of nutrients and water.
Soil formation is strongly influenced by geological factors (bedrock type), climate and living organisms. Due to the complex interplay of these factors, soils start forming with the fragmentation and weathering of the bedrock, following which plants and animals, soil fungi and micro-organisms of the soil (i.e., the edafon) are all responsible for the further complex transformation processes of the soil.
Soil is a three-phase (solid-liquid-gaseous) polydisperse system, with the following components: (Figure 19):
1. the soil solution
2. the soil colloids: organic-mineral complexes (clay minerals and organic molecules) which constitute colloidal-sized particles in the soil.
3. the air between the soil particles
4. other organic components and the humus
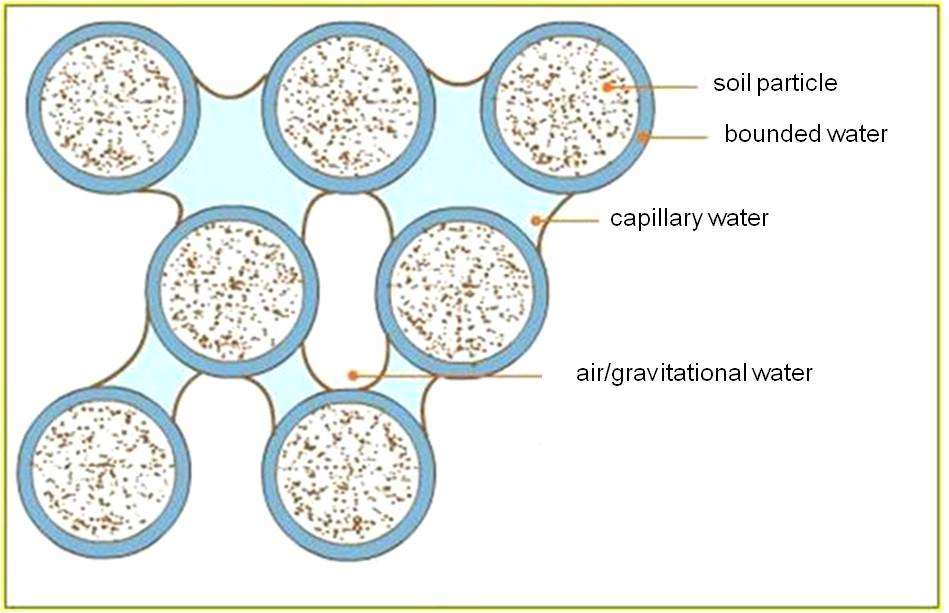
Figure 19: The soil components
Humus and its development
One of the important components of the soil is the humus, which is a collective name for the organic matter in the soil. Humus is made of complex organic macromolecules resulted from the decay of dead plants and animals, soaked in humus acids.
Most of the dead plant and animal residues in the soil are decomposed by microorganisms and fungi, which is followed by the process of mineralization. The resulting inorganic substances (i.e., nutrients for the plants) are thus re-included in nutrient cycle.
A part of the decomposed organic matter is not mineralized, but becomes the main structural component of the humus (e.g., simple sugars and amino acids, proteins and their products, closed aromatic ring compounds which forms phenols and quinines). These compounds are connected to each other through chemical processes (condensation, polymerization) to form macro-molecules and thus become the constituents of dark humus. Microorganisms are not able to decompose these macromolecules or only do that very slowly, and therefore these humus materials temporarily exit from the ecosystem’s nutrient cycle. Thus the humus acts as the ecosystem’s nutrient storage because its very slow degradation enables a continuous replenishment of soils with nutrients.
Soil properties
- Structure – refers to how loose, aerated or aggregated the soil is. The dimension of soil grains and the volume of pores (i.e., soil porosity) are important to plants, because they affect the development of the roots, the soil permeability for water and soil aeration. The smaller the pores, the more compact the soils are; this can mean decreased soil permeability for water and less living space for microorganisms (e.g., in clayey soils). In contrast, extremely loose soils have a poor water holding capacity (e.g., sandy soils). The soil structure is influenced by the ions adsorbed on the surface of the soil colloids. Calcium-rich soils are crumbly, well-aerated, whereas colloids in soils of high sodium content (saline soils) coagulate and soils are poorly aerated.
- Temperature: Has a significant effect on root growth, it affects seed dormancy, seed germination and the soil nutrient supply through influencing the speed of decaying processes and the activity of microorganisms. Extreme soil temperatures represent a stress factor for plants, e.g. in overheated soils during summer, whereas in the winter the frozen water causes water stress in roots.
- PH: Is an important factor because it influences the solubility of soil nutrients. Plants generally prefer neutral and slightly basic soils which, due to the presence of Ca ions, have a good structure and a favourable humidity. Some plants can also tolerate alkaline and acidic soils, but in order to achieve that they have different adaptive strategies. For example, mycorrhizae can enhance significantly the nutrient absorption.
-Humus content and humus characteristics are important in controlling the nutrient exchange, water balance and soil pH.
- Water content: hygroscopic water, capillary water and gravitational water:
Water in the soil exists in three forms; (i) the colloidal soil particles are associated with an extremely thin film of moisture that adheres to soil particles, which is the hygroscopic water or bound water, (ii) the capillary water that moves between the soil particles, and (iii) the gravitational water that originates from precipitation and is drained downwards by gravity. Only the latter two constitute a source of water for plants.
As seen before, the vegetation composition is strongly influenced by the soil properties. Several plant species are sensitive to the soil properties and can only tolerate a narrow interval of the soil parameters. These plants are soil indicators.
Species that indicate acid soils (i.e., acidophilus plants) are the blueberries Vaccinium myrtillus, V. vitis-idaea, the Wood sorrel (Oxalis acetosella) (Figure 20.), the Heather (Calluna vulgaris), many species of Rhododendron and the Sheep’s sorrel (Rumex acetosella).
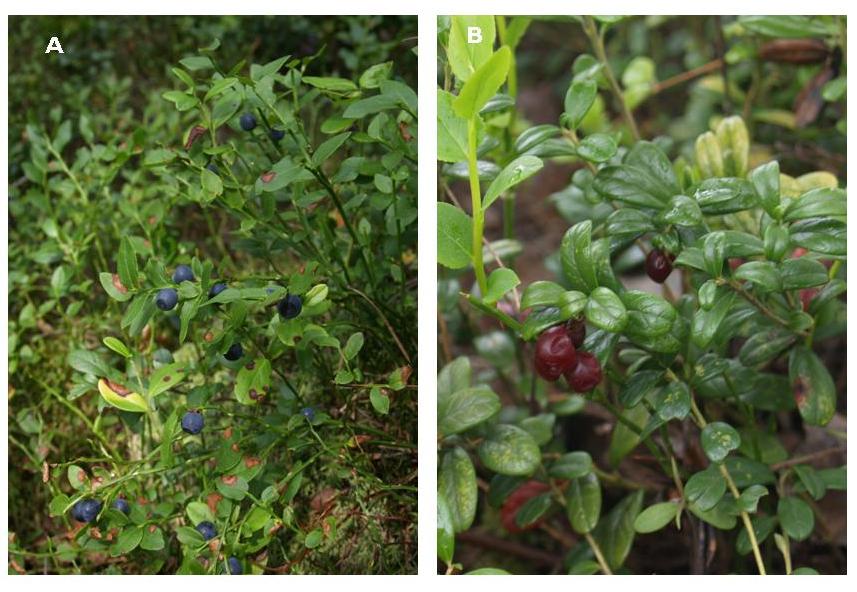
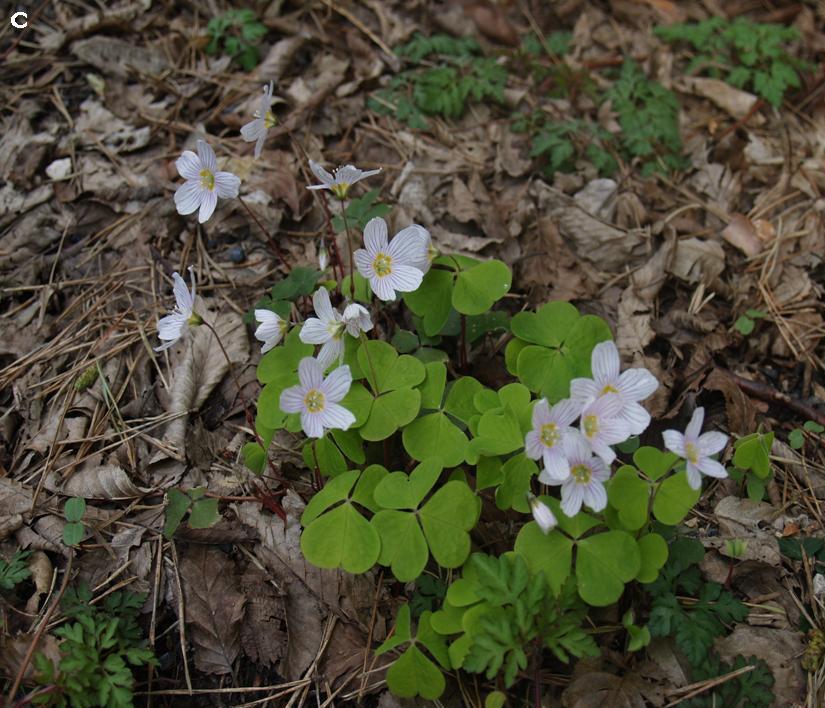
Figure 20: Acidic soil indicator species
Bilberry (Vaccinium myrtillus) A., Lingonberry (Vaccinium vitis-idaea) B, Wood sorrel (Oxalis acetosella) C.
Plants which are adapted to a high salt content are indicators of solonetz soils or of soils of very high salt concentration and poor structure – solonchaks. For example, the Sea aster (Aster tripolium), the Sea plantain (Plantago maritima) and late flowering Sea lavender (Limonium gmelini subsp. hungaricum) indicate saline soils (Figure 21).
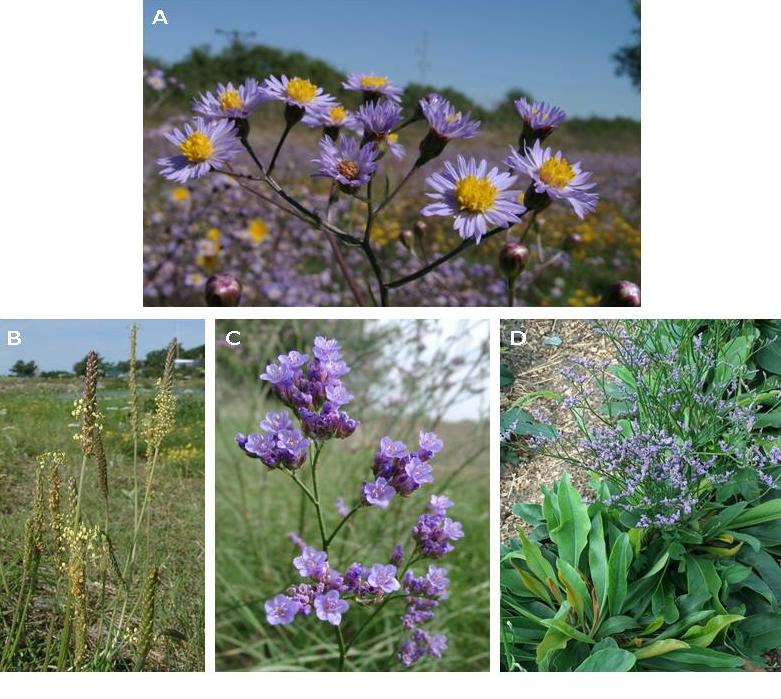
Figure 21: Salty soil indicator species.
A. Sea aster (Aster tripolium subsp. pannonicum), B. Sea plantain (Plantago maritima), C. D. Sea lavender (Limonium gmelini subsp. hungaricum)
The high water content of the soil is indicated by species such as the Yellow flag (Iris pseudacorus), species of rushes such as the Soft rush ( Juncus effusus) (Figure 22.), sedge species such as Lesser pond sedge (Carex acutiformis). The marshy, oxygen-poor soils are indicated by tree species such as the alders, e.g. black alder (Alnus glutinosa). Alder roots establish symbiotic relationships with actinomycete fungi that enhance the nitrogen uptake from the inorganic, nitrogen poor soils.
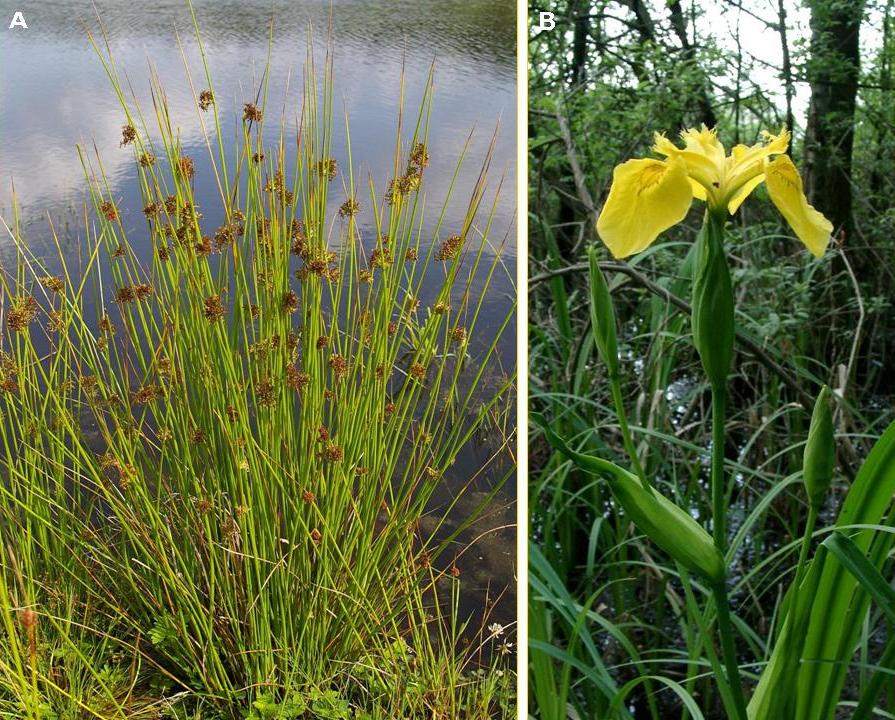
Figure 22. High ground water level indicator species: Soft rush (Juncus effussus), A., Yellow flag (Iris pseudacorus) B.
Some plant species are indicators of high metal ion concentrations in the soil. Most plants avoid such habitats, but some grow well in these ion- saturated soils. The latter are able to accumulate ions in their tissues. For example, the Irish moss (Minuartia verna) is well-known as an indicator of elevated lead concentrations, and the field horsetail (Equisetum arvense) is an indicator of increased zinc content.
There are some plant species that are able to indicate the elevated nitrogen content in the soil by an increased population density and tall-growing individuals that can encroach the habitats. The "neck length" Stinging nettles by the landfills, the Common hop and elderberries grown above animal carcasses are well-known “indicator” situations.
Soil types
Based on the factors that influence soil formation, soils can be:
1. Zonal soils: reflect the influence of the macroclimate. They cover large areas, follow the climate zones across the globe, and have very well developed structure. Zonal soils include e.g. tropical laterite soils and brown forest soils of the temperate zones.
2. Intrazonal soils: usually occupy restricted areas and are associated with zonal soils. The evolution of these soils is determined by local factors, mainly by the influence of the dominant bedrock. For example rendzina soils are characteristic of limestone.
3. Azonal soils: their development is driven by factors other than the climate and bedrock, which may be local factors such as e.g. water. The structure is usually incomplete and there is no advanced soil profile. Marshy soil, sediment soils and saline soils belong to this group.
In Hungary, beside the typical temperate zonal soil types many other soil types develop intrazonally or azonally due to edaphic factors.
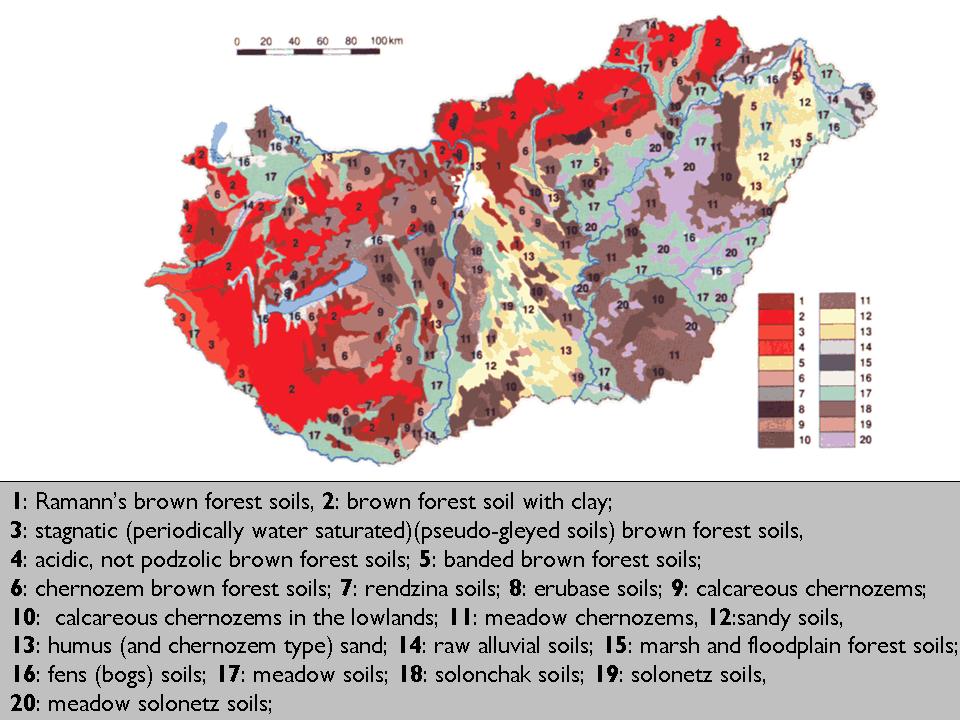
Figure 23: Soil map of Hungary with major soil types.
6.2.5. Climate and atmospheric conditions
Climate is a combined effect of several environmental factors. The temperature and the amount and distribution of the rainfall are essential, but the prevailing winds, distance from the sea (continentality) and the topography of the land surface are also determining factors.
The Earth's climate zones can be characterized with the average annual temperature and the average annual rainfall. Based on the amount of rainfall and evaporation, climate types might be classified as:
- Humid climates: when an area has a positive water balance (more precipitation falls than evaporates)
- Arid climates: when there is a negative water balance, with extreme drought.
- Semi-arid climates: water shortage in certain periods of the year, including the growing season.
- Semi-humid climates: increased rainfall during certain periods of the year, mainly in the growing season.
Climatic conditions in an area can be expressed as climate diagrams. These diagrams show the monthly average temperature in relation to the distribution of monthly precipitation.
First represented by Gaussen-Walter, the climate diagrams are widely used in plant geography and ecology to describe and compare the climate of different vegetation zones. They are based on Szeljanyinov's hydrothermal coefficient (Qh) and Walter-Bagnouls xerothermic index (I). According to the Walter-Bagnouls xerothermic index, a month is considered dry if the total monthly rainfall is less than twice the temperature value. The graphic contains the temperature and the monthly distribution of precipitation shown on the two vertical axes of the graph, where 10µC correspondto 20mm of precipitation. The horizontal axis shows the months of the year, so it is possible to read the duration and intensity of the humid, arid and transitional periods (See textbox on how to construct climate diagrams).
The climate diagrams of various cities from the different climate zones of the Earth are shown in Figure 24.
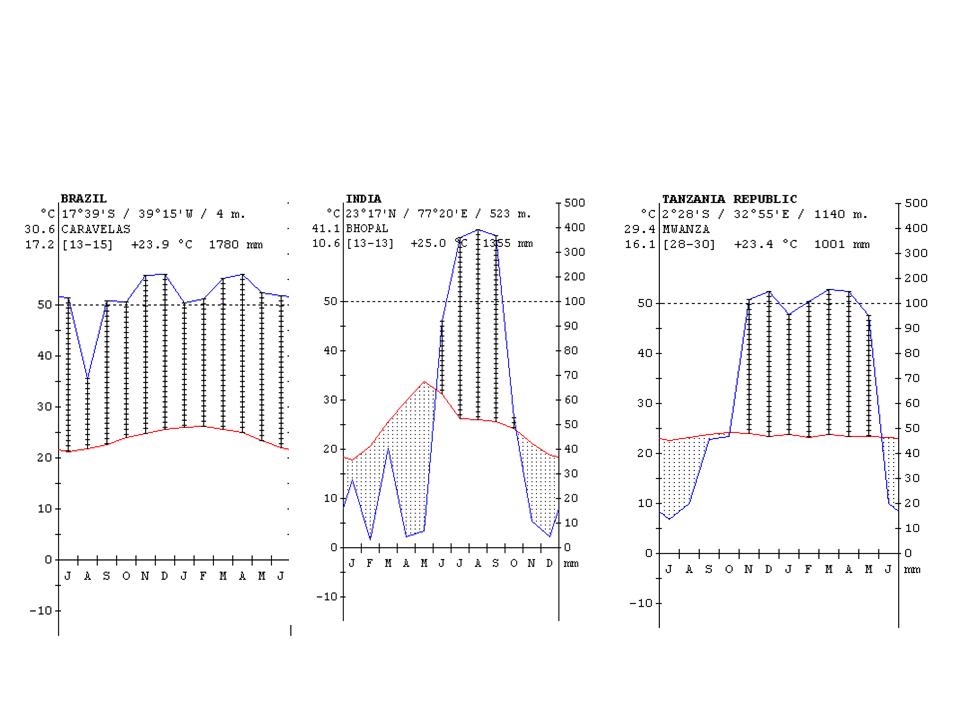
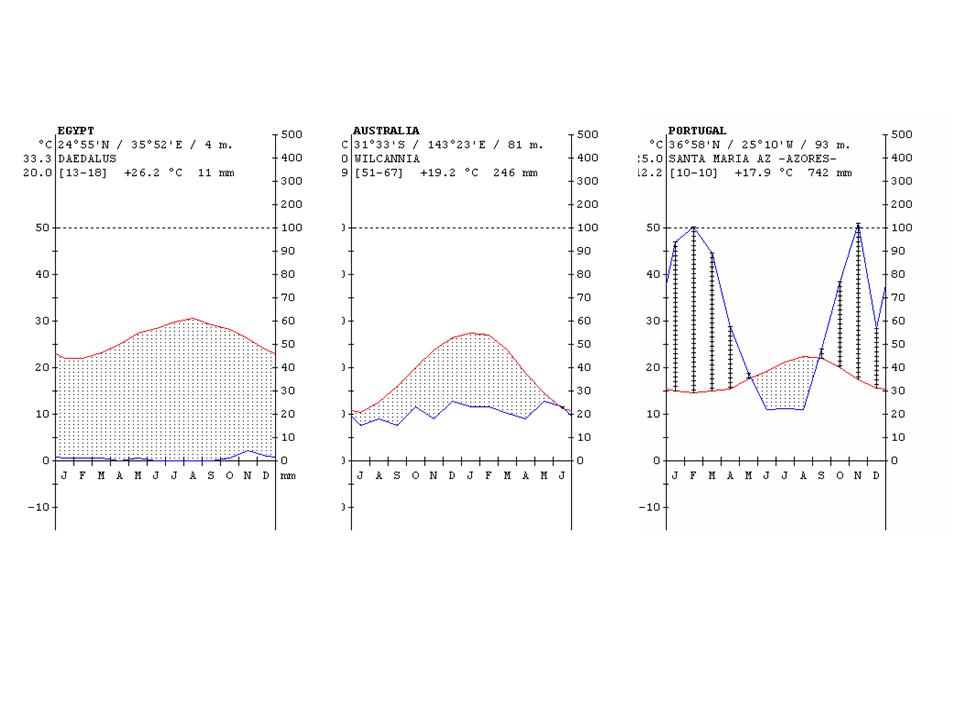
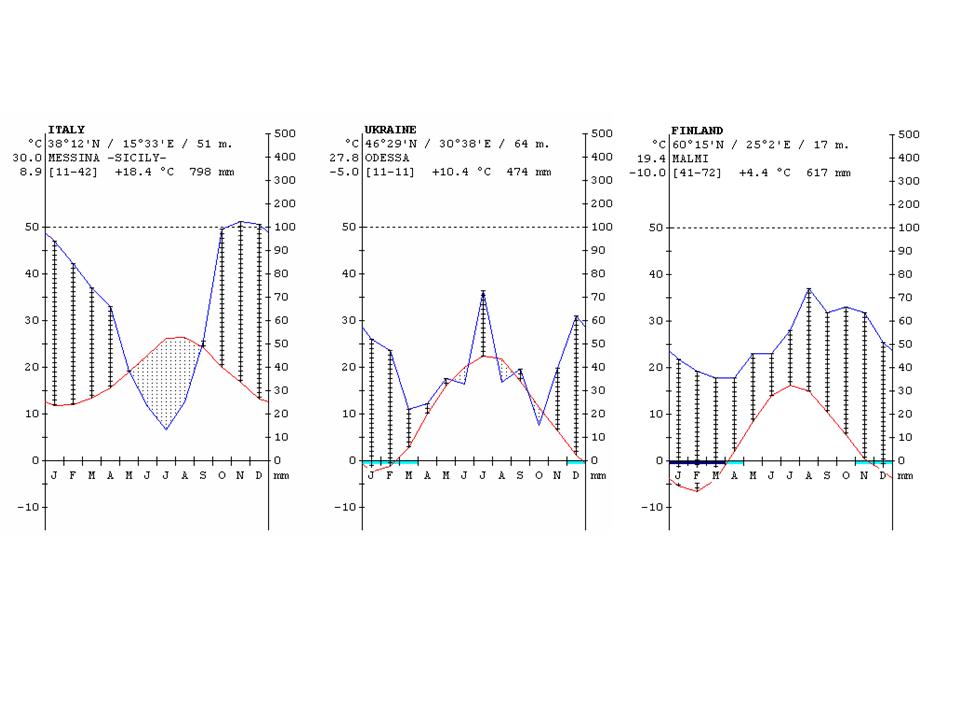
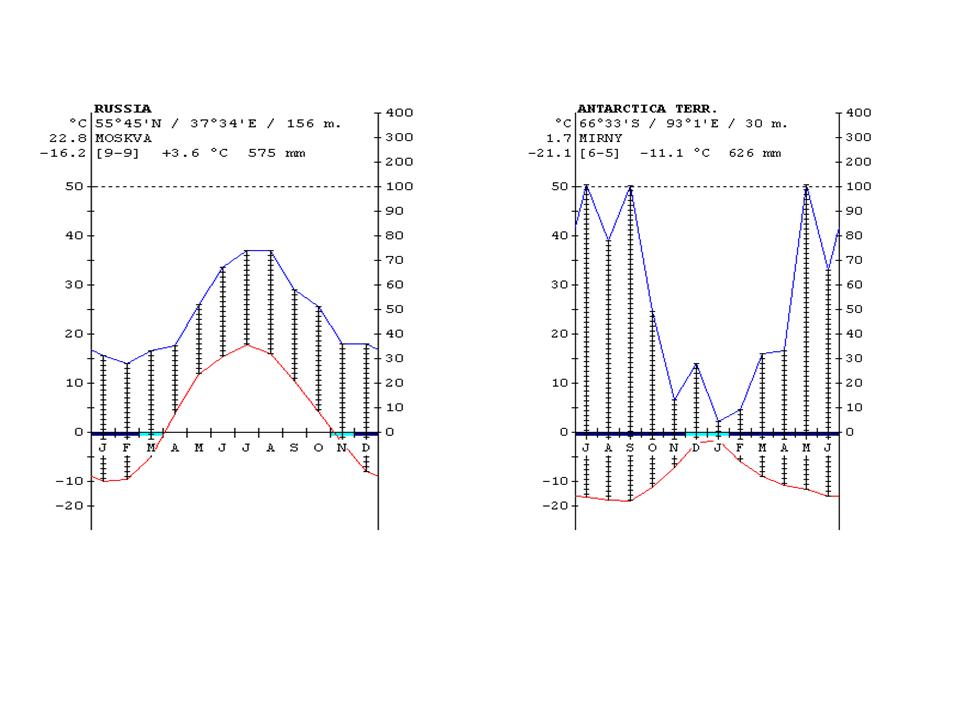
Figure 24: Climate diagrams of major climate zones of the Earth (the vertical lines show the humid climate, a nd the dotted areas where the rainfall is below the temperature curve shows arid climate) http://www.ucm.es/info/cif.
The climate of Hungary
The CarpathianBasin is influenced by several types of climate. This region is mainly characterized by a Central European continental climate with maximum precipitations during early summer and long lasting drought in the summer. The area receives a warm autumn- spring humid sub-Mediterranean climatic influence from South, and cool summers as Atlantic-Alpine climatic influence from West. The different climatic influences affect different parts of the country, which explains the uneven distribution and productivity of plant communities.
There is an important geographic line between the humid and semi-arid areas in Hungary, which separates the closed broadleaved forest zone (the vegetation of the Transdanubian region and of the Central Mountains) from the forest-steppe vegetation zone (the lowland area to East) (Figure 25).
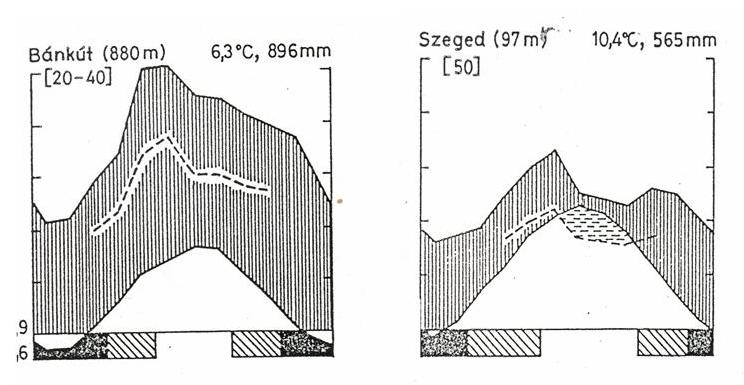
Figure 25: Two different climate diagrams of Hungary in two distinct vegetation types: closed broadleaved forest (Bánkút) and forest-steppe (Szeged).
Air composition and air movement
The lower part of the atmosphere in which due to the heating effect of the Earth's surface air currents and turbulence are common is called thetroposphere. Its height ranges between 16km (at the tropics) to 10km (at latitudes of 60 degrees). Just above the troposphere lays the stratosphere, where the temperature is relatively constant, but in its upper third part strong gas movement can take place. At about a 32 kmheight in the stratosphere lays the ozone layer (O3), which filters out the harmful UV radiation. Stratospheric gases also prevent the rapid cooling of the Earth's surface. Above the stratosphere lays the ionosphere, in which large quantities of ions form under the effect of UV radiation and oxygen molecules disintegrate. This layer is situated at elevations above 100 - 110 km. Although all atmospheric parameters have contributed to the evolution of life, from an ecological point of view only the lower part of the atmosphere is considered an environmental factor. Therefore all air parameters refer to the troposphere.
The air contains constant (N2, O2, noble gases) and variable (CO2, water vapors) components. An increased air humidity is beneficial for plants because it balances the air temperature and decreases the evapo-transpiration (water loss). Dry air is much more unfavorable for plants.
CO2 is a variable component of the air. It is released into the air due to the respiration of organisms, microorganism activity in the soil and volcanic activity. Recently, the amount of CO2 released in the atmosphere increased critically as a result of the human activity (especially industrial exhausts). Because of the increasing CO2 concentration, the intensity of photosynthesis can also increase to a certain extent and thus the primary production decreases the CO2 volume in the air by carbon fixation. Massive deforestations and conversion of grasslands to agricultural land has decreased considerably the carbon storage capacity of ecosystems, which then causes the CO2 accumulation in the air. The elevated CO2 levels contribute to the greenhouse effect. The greenhouse effect happens because the infrared radiation that warms the Earth surface cannot be reflected to the upper layers of the atmosphere, and is instead trapped in the troposphere because of the increased concentration of CO 2 and other pollutant gases.
In the dry, hot seasons of the year CO2 is an important limiting factor for plants because CO2 uptake cannot happen through closed stomata. As a result, C4 plants are advantaged under decreased precipitation conditions due to their more effective CO2 uptake. Carbon fixation is a key factor in Earth’s CO2 cycle and its effects on ecosystem functioning are manifold.
SO2, which results from industrial exhaust is also accumulating in the atmosphere and has a harmful effect on plants. The high SO2 content of the air and the acid rains produced as a result threatens many types of ecosystem.
The amount of solid components in the air is variable. These contribute to the air pollution, producing e.g., soot and smog. The smog which accumulates around the cities and industrial sites is harmful for all living beings. It is particularly problematic in calm and hot summer days or in foggy winter time. Plants react differently to smog, but chlorosis and silvery, bronzing tissues are usually caused by smog. Some horticultural plants such as the spinach, Swiss chard, the tomatoes and the beets are very sensitive, whereas others such as the beans, the cabbage and the corn are resistant to smog damage.
Air currents
Winds can have both positive and negative effect on plants.
The positive effect is when winds mediate the dispersal of pollen and fruits. Plants whose pollen is dispersed by wind are called anemogamous (anemophilous) species.
The most visible features of wind-pollinated species are:
- they usually produce a lot of pollen;
- the perianth is insignificant, reduced or absent;
- the flowers are often imperfect (diclinous), the male flowers are dense, form catkins and bloom early in the spring before the leaves appear;
- usually do not produce nectar;
Anemophilous species are e.g. the hazel (Corylus avellana), the walnut (Juglans regia), the Hungarian ash ( Fraxinus angustifolia subsp. danubialis), and from among the herbaceous plants the grasses and the sedges (more anemophilous species in Figure 26).
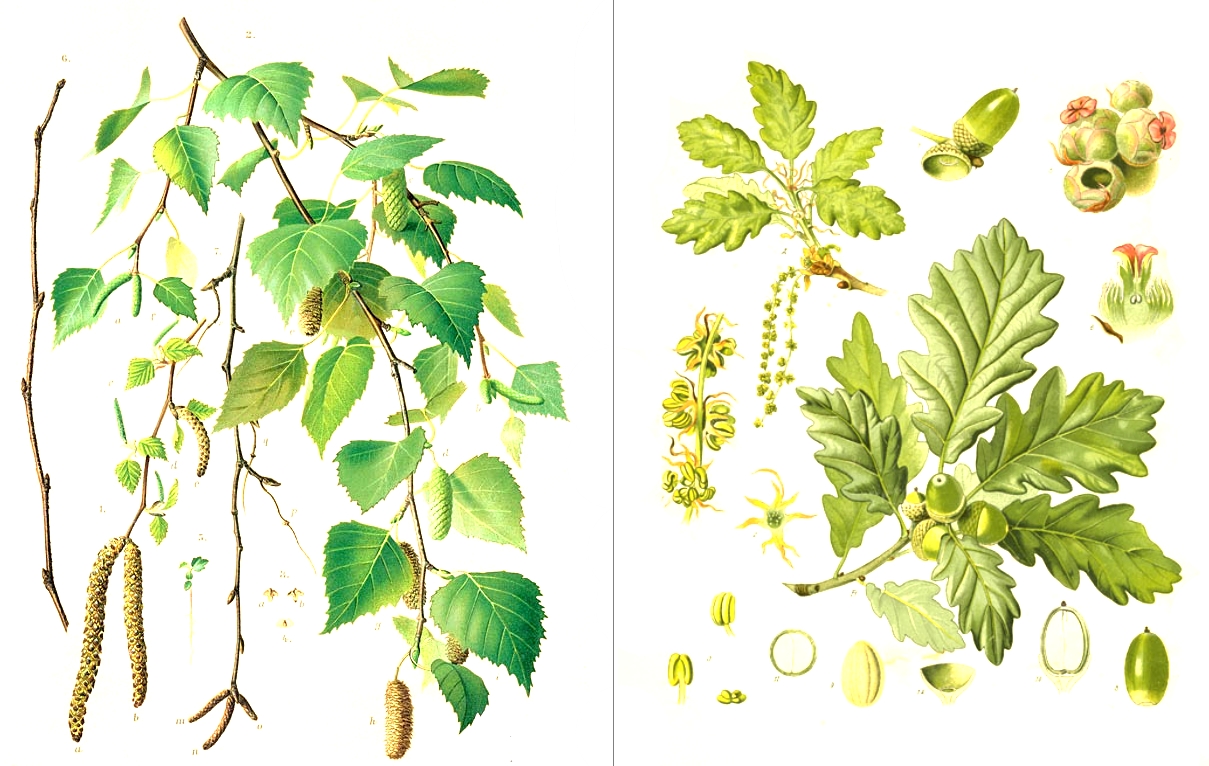
Figure 26: Anemochorous species
A. Betula pendula (Silver birch), B. Quercus robur (English oak) (Tuzson J. 1926)
Anemochorous species spread their fruits and seeds using the wind.
These fruits/seeds are often:
- produced in large quantities
- are lightweight
- are winged or hairy
Anemochorous propagules
The light fruits or seeds such as those of willows, poplars or orchids do not contain, or have just a small amount of nutrients. Such seeds have to germinate immediately (without dormancy) and very often only germinate when a fungal partner is present. In orchids, when the embryo starts to germinate it develops a symbiotic relationship with a fungal partner that helps it to absorb vital nutrients. (See more details about anemochorous fruits and seeds in Chapter 4).
Winds can also exert indirect effects on plants. The prevailing winds may be climate-driving factors and can be responsible for generating humid or arid climate types. Winds may increase the aridity and as a result, the physiological water stress in plants.
Sudden, raging winds may cause forest blowdowns and may cause soils to dry up. Soil erosion caused by winds is called deflation. In tropical areas which once were covered with forests, deflation can have severe consequences (Figure 27).
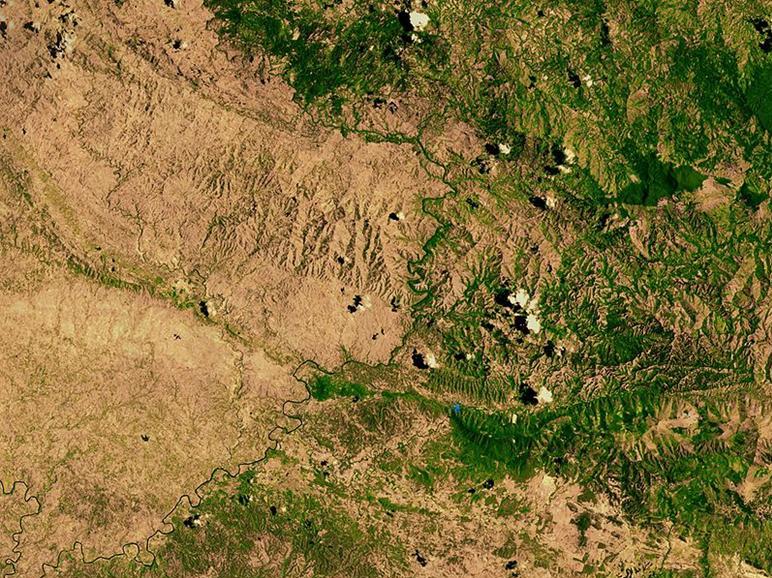
Figure 27: Deflation and erosion on Hispagnola Island
An aerial view of Haiti and the border with the Dominican Republic(Caribbean. In Haiti forests were cut and in consequence on large territories deflation and erosion is much more advanced than in the bordering country.
References
- Láng Ferenc (szerk.): Növényélettan, ELTE Eötvös Kiadó, Budapest, 2007.
- Mátyás Cs. 1997: Erdészeti ökológia. Mezőgazda kiadó.
- Pásztor E., Oborny B. (szerk.) 2007: Ökológia. Nemzeti Tankönyvkiadó.
- Simon T. (szerk.) (2001): Növényföldrajz, Társulástan és Ökológia. Tankönyvkiadó. Budapest.
- Török p., Tóthmérész B. (2006): Növényökológiai alapismeretek. Kossuth Egyetemi kiadó. Debrecen.
- Turcsányi G. (szerk.) 1998: Mezőgazdasági növénytan. Mezőgazdasági Szaktudás Kiadó. Budapest. 2. kiadás
![]()
![]()

Hírek/News
Sajtóközlemény
A projekt célja magyar és angol nyelvű digitális tananyagok fejlesztése a Budapesti Corvinus Egyetem Kertészettudományi Karának hét tanszékén. Az összesen 14 tananyag (hét magyar, hét angol) a kertészmérnök Msc szak és a multiple degree képzés keretében kerül felhasználásra. A digitális tartalmak az Egyetem e-learning keretrendszerével kompatibilis formában készülnek el.
BővebbenSikeres pályázat
A projekt célja magyar és angol nyelvű digitális tananyagok fejlesztése a Budapesti Corvinus Egyetem Kertészettudományi Karának hét tanszékén. Az összesen 14 tananyag (hét magyar, hét angol) a kertészmérnök Msc szak és a multiple degree képzés keretében kerül felhasználásra. A digitális tartalmak az Egyetem e-learning keretrendszerével kompatibilis formában készülnek el.
A tananyagok az Új Széchenyi Terv Társadalmi Megújulás Operatív Program támogatásával készülnek.
TÁMOP-4.1.2.A/1-11/1-2011-0028
Félidő
A pályázat felidejére elkészültek a lektorált tananyagok, amelyek feltöltése folyamatban van.
![]() TÁMOP-4.1.2.A/1-11/1-2011-0028
TÁMOP-4.1.2.A/1-11/1-2011-0028